PROTECTED SOURCE SCRIPT
Updated Trading Signals
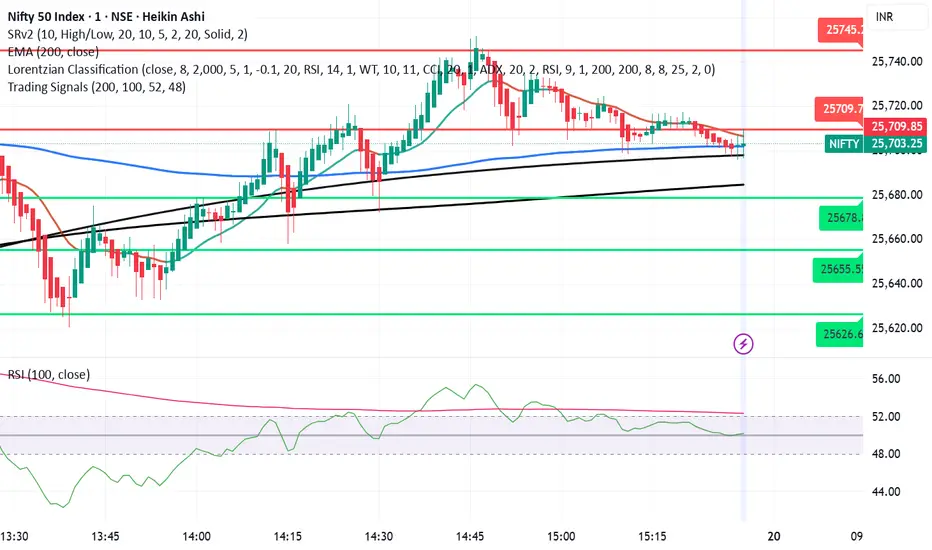
This script is designed to help identify high-probability trend reversal and continuation signals by combining moving average crossovers with momentum confirmation.
✨ How It Works:
EMA 200 — plots the 200-period Exponential Moving Average (EMA) of the closing price.
EMA-based SMA 200 — applies a 200-period Simple Moving Average (SMA) on top of the EMA values for smoother trend tracking.
Relative Strength Index (RSI) (Length 100) is used as a momentum filter to avoid false signals.
🟢 Buy Signal Conditions:
EMA 200 crosses above the EMA-based SMA 200.
RSI (100) is greater than 52, confirming bullish momentum.
🔴 Sell Signal Conditions:
EMA 200 crosses below the EMA-based SMA 200.
RSI (100) is less than 48, confirming bearish momentum.
Release Notes
This script is designed to help identify high-probability trend reversal and continuation signals by combining moving average crossovers with momentum confirmation.✨ How It Works:
EMA 200 — plots the 200-period Exponential Moving Average (EMA) of the closing price.
EMA-based SMA 200 — applies a 200-period Simple Moving Average (SMA) on top of the EMA values for smoother trend tracking.
Relative Strength Index (RSI) (Length 100) is used as a momentum filter to avoid false signals.
🟢 Buy Signal Conditions:
EMA 200 crosses above the EMA-based SMA 200.
🔴 Sell Signal Conditions:
EMA 200 crosses below the EMA-based SMA 200.
Protected script
This script is published as closed-source. However, you can use it freely and without any limitations – learn more here.
Disclaimer
The information and publications are not meant to be, and do not constitute, financial, investment, trading, or other types of advice or recommendations supplied or endorsed by TradingView. Read more in the Terms of Use.