PROTECTED SOURCE SCRIPT
Dynamic Breakout Odds [RayAlgo]
█ OVERVIEW
Dynamic Breakout Odds [RayAlgo] is a probability-based breakout tool that uses ATR and pattern matching to estimate how likely price is to expand [u]up or down[/u] from the current candle.
Instead of guessing, the indicator scans historical candles that look like the current one and measures how often price broke above or below by a volatility-based amount.
It then projects those probabilities forward as clean levels and a bias dashboard on your chart.
Use it to quickly answer:
• “Is the next move statistically more likely up or down?”
• “How far does price typically travel from here, in ATR terms?”
█ CONCEPTS
Candle Profile Matching
The script builds a “profile” of the current setup using two elements:
• The color of the previous candle (bullish close vs bearish close)
• The trend environment (above/below EMA, if the filter is enabled)
Only historical candles with the same profile are used for statistics. This keeps the probabilities specific to the current context instead of mixing all market conditions together.
ATR-Based Expansion
For every matching historical candle, the script checks how far price moved away from the open using ATR:
• Upward move thresholds
• Moderate expansion (≈ 0.5 ATR above the open)
• Stronger expansion (≈ 1.0 ATR above the open)
• Downward move thresholds
• Moderate expansion (≈ 0.5 ATR below the open)
• Stronger expansion (≈ 1.0 ATR below the open)
It counts how often each expansion happened, then converts those counts into probabilities.
Normalized Probability Scores
The indicator doesn’t just show raw percentages; it normalizes them so that all scenarios together form a consistent probability set.
Internally it tracks four outcomes for similar candles:
• Chance of a moderate move upward
• Chance of a strong move upward
• Chance of a moderate move downward
• Chance of a strong move downward
These are then normalized so the total is roughly 100%. From this, two main metrics are derived:
• Bullish Strength = combined normalized odds of upside moves
• Bearish Strength = combined normalized odds of downside moves
Whichever side has the higher score defines the current directional bias.
█ WHAT YOU SEE ON THE CHART
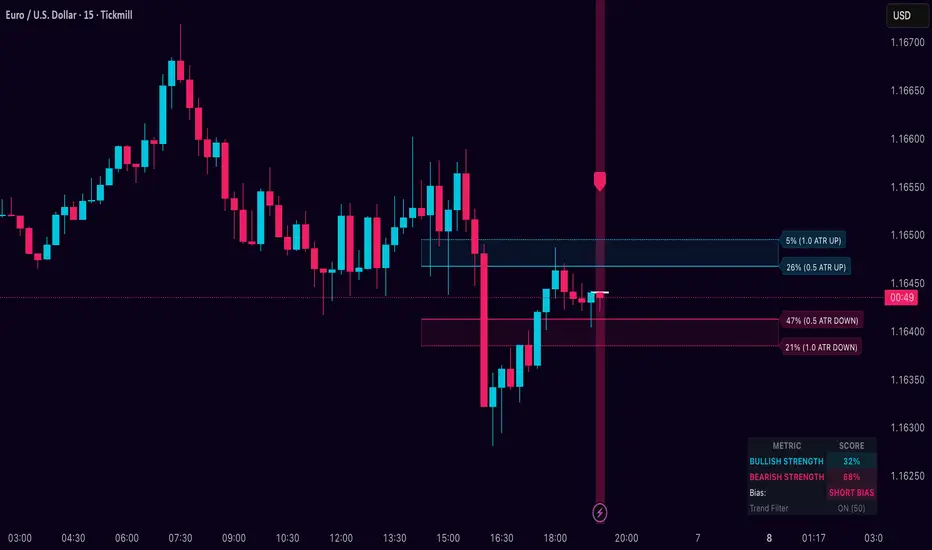
1. Breakout Projection Levels
Four horizontal levels are projected around the open of the current bar:
• Two upside levels
• Nearer upside expansion (~0.5 ATR above the open)
• Further upside expansion (~1.0 ATR above the open)
• Two downside levels
• Nearer downside expansion (~0.5 ATR below the open)
• Further downside expansion (~1.0 ATR below the open)
Each line extends a configurable number of bars into the future, so you visually see a breakout “corridor” above and below price.
2. Probability Labels
At the right edge of each line, you’ll see a label such as:
• “X% – near upside”
• “Y% – further downside”
These labels tell you how frequently similar candles in the chosen lookback reached that expansion. You immediately know which scenario has been more common historically.
3. Breakout Zones
Between the paired upside lines and the paired downside lines, shaded “probability zones” can be shown:
• The upper shaded band highlights the typical upside expansion range
• The lower shaded band highlights the typical downside expansion range
These zones visually group probable target areas instead of just single lines.
4. Background Tint
The background behind price is softly tinted towards:
• Bullish color when Bullish Strength > Bearish Strength
• Bearish color when Bearish Strength > Bullish Strength
The stronger the statistical imbalance between the two, the more pronounced the tint. This gives you an instant feel for whether conditions lean more Long, more Short, or are nearly Neutral.
5. Directional Bias Arrow
On the last bar the script can plot a clean arrow:
• Up-arrow below price when bullish odds dominate
• Down-arrow above price when bearish odds dominate
The arrow is positioned beyond all projection lines, making it easy to see even on cluttered charts and reminding you of the current statistical bias without text.
6. Origin Marker
A small horizontal mark is drawn at the open of the current candle.
This acts as the “starting point” from which all ATR-based expansions above and below are measured.
7. Dashboard Panel
A compact dashboard is drawn in a corner of the chart (location configurable). It displays:
• Bullish Strength – combined normalized probability for upside expansions
• Bearish Strength – combined normalized probability for downside expansions
• Bias – “Long Bias”, “Short Bias”, or “Neutral”
• Trend Filter – shows whether EMA-based filtering is ON or OFF and which length is used
This gives you a quick, text-based summary of the current statistical environment.
█ SETTINGS
Analysis Lookback Period
• Controls how many historical bars the script inspects when searching for similar candles.
• Larger values = more history, smoother statistics, slower adaptation.
• Smaller values = faster adaptation, but more noise and less stability.
ATR Length
• The period used to compute ATR volatility.
• Defines how “big” 0.5 ATR and 1.0 ATR moves are on your current symbol and timeframe.
Trend Filter (EMA)
• Filter by Trend?
• When ON, only historical candles in a similar trend regime are used.
• When OFF, all past candles with similar color are considered, regardless of trend.
• Trend EMA Length
• EMA period used to classify trend.
• Price above EMA → uptrend environment.
• Price below EMA → downtrend environment.
This filter helps you separate behavior in uptrends from downtrends, which can significantly change breakout dynamics.
Visual Settings
• Projection Width (bars)
• How far the lines and zones extend into the future.
• Show Probability Zones
• Toggle shaded bands between each pair of levels.
• Label Size
• Choose smaller or larger text for the probability labels on the right.
• Tint Background by Bias
• Turn the bias-based background on or off.
• Show Bias Marker on Last Candle
• Toggle the up/down arrow marker.
• Dashboard Location
• Select top/bottom left/right corner for the panel.
█ HOW TO USE IT
1. Start With the Dashboard
Look at Bullish Strength vs Bearish Strength:
• If bullish is clearly larger → environment statistically favors upside expansion.
• If bearish is clearly larger → environment statistically favors downside expansion.
• If they are close → treat the situation as Neutral; consider reducing position size or waiting for more clarity.
2. Use Levels as Dynamic Targets
The projected lines and zones can serve as:
• Profit targets based on typical expansion distance
• Logical regions for scaling out
• Areas where you expect price behavior to change (e.g., loss of momentum)
Short-term traders often focus on the nearer expansion levels, while swing traders may use the farther levels as extended targets.
3. Align With Trend (Optional)
With the trend filter ON:
• Prefer Long setups when price is above the EMA and bullish probabilities dominate.
• Prefer Short setups when price is below the EMA and bearish probabilities dominate.
With the filter OFF, you get pure color-plus-pattern statistics across the whole lookback, which can be useful if you deliberately trade counter-trend or range conditions.
4. Combine With Your Existing System
Dynamic Breakout Odds is best used as a confirmation and targeting layer:
• Combine it with structure (support/resistance, supply/demand, order blocks).
• Combine it with volume or orderflow tools if you use them.
• Use the probability zones to validate whether your planned target is realistic relative to recent volatility.
It is not designed to be a standalone “buy/sell” signal generator, but a statistical map around your entries.
█ PRACTICAL EXAMPLES
Example A – Bullish, Moderate Expansion Frequently Hit
• Bullish Strength significantly higher than Bearish Strength.
• The nearer upside level shows a strong historical hit rate.
Interpretation: similar setups often produce at least a moderate push upward before failing.
Use case: trade pullbacks in the direction of the bias, targeting the nearer upside projection as an initial take-profit.
Example B – Bearish, Deeper Downside Often Reached
• Bearish Strength clearly dominant.
• Both the nearer and farther downside levels show decent probabilities.
Interpretation: similar conditions historically saw follow-through to the downside.
Use case: use rallies against the direction of the bias to position into shorts, planning partial exits around the first downside projection and runners toward the second.
Example C – Neutral, Balanced Probabilities
• Bullish and Bearish Strength scores are close.
• Background tint is very light or absent.
Interpretation: the market is statistically indecisive; expansions up or down are similarly likely.
Use case: consider range trading tactics, mean-reversion ideas, or simply standing aside until a clearer skew develops.
█ BEST PRACTICES
• Use on liquid symbols and reasonable timeframes to avoid distorted ATR behavior.
• Don’t overfit lookback length to a single instrument; test across markets.
• Let the indicator provide context, not absolute certainty.
• Always combine with proper risk management (position sizing, max loss per trade, etc.).
• Be cautious with very small sample sizes (e.g., very short lookbacks on low-volume assets).
█ LIMITATIONS & NOTES
• All probabilities are based on historical behavior; markets can change regime.
• ATR distances are relative to recent volatility and may shrink/expand over time.
• The script intentionally does not guarantee any direction or target; it only reports what has been most common in similar past situations.
█ DISCLAIMER
This tool is for educational and informational purposes only.
It does not constitute financial advice or a guarantee of performance.
Always do your own research, test on demo or historical data, and use appropriate risk management when trading live capital.
Dynamic Breakout Odds [RayAlgo] is a probability-based breakout tool that uses ATR and pattern matching to estimate how likely price is to expand [u]up or down[/u] from the current candle.
Instead of guessing, the indicator scans historical candles that look like the current one and measures how often price broke above or below by a volatility-based amount.
It then projects those probabilities forward as clean levels and a bias dashboard on your chart.
Use it to quickly answer:
• “Is the next move statistically more likely up or down?”
• “How far does price typically travel from here, in ATR terms?”
█ CONCEPTS
Candle Profile Matching
The script builds a “profile” of the current setup using two elements:
• The color of the previous candle (bullish close vs bearish close)
• The trend environment (above/below EMA, if the filter is enabled)
Only historical candles with the same profile are used for statistics. This keeps the probabilities specific to the current context instead of mixing all market conditions together.
ATR-Based Expansion
For every matching historical candle, the script checks how far price moved away from the open using ATR:
• Upward move thresholds
• Moderate expansion (≈ 0.5 ATR above the open)
• Stronger expansion (≈ 1.0 ATR above the open)
• Downward move thresholds
• Moderate expansion (≈ 0.5 ATR below the open)
• Stronger expansion (≈ 1.0 ATR below the open)
It counts how often each expansion happened, then converts those counts into probabilities.
Normalized Probability Scores
The indicator doesn’t just show raw percentages; it normalizes them so that all scenarios together form a consistent probability set.
Internally it tracks four outcomes for similar candles:
• Chance of a moderate move upward
• Chance of a strong move upward
• Chance of a moderate move downward
• Chance of a strong move downward
These are then normalized so the total is roughly 100%. From this, two main metrics are derived:
• Bullish Strength = combined normalized odds of upside moves
• Bearish Strength = combined normalized odds of downside moves
Whichever side has the higher score defines the current directional bias.
█ WHAT YOU SEE ON THE CHART
1. Breakout Projection Levels
Four horizontal levels are projected around the open of the current bar:
• Two upside levels
• Nearer upside expansion (~0.5 ATR above the open)
• Further upside expansion (~1.0 ATR above the open)
• Two downside levels
• Nearer downside expansion (~0.5 ATR below the open)
• Further downside expansion (~1.0 ATR below the open)
Each line extends a configurable number of bars into the future, so you visually see a breakout “corridor” above and below price.
2. Probability Labels
At the right edge of each line, you’ll see a label such as:
• “X% – near upside”
• “Y% – further downside”
These labels tell you how frequently similar candles in the chosen lookback reached that expansion. You immediately know which scenario has been more common historically.
3. Breakout Zones
Between the paired upside lines and the paired downside lines, shaded “probability zones” can be shown:
• The upper shaded band highlights the typical upside expansion range
• The lower shaded band highlights the typical downside expansion range
These zones visually group probable target areas instead of just single lines.
4. Background Tint
The background behind price is softly tinted towards:
• Bullish color when Bullish Strength > Bearish Strength
• Bearish color when Bearish Strength > Bullish Strength
The stronger the statistical imbalance between the two, the more pronounced the tint. This gives you an instant feel for whether conditions lean more Long, more Short, or are nearly Neutral.
5. Directional Bias Arrow
On the last bar the script can plot a clean arrow:
• Up-arrow below price when bullish odds dominate
• Down-arrow above price when bearish odds dominate
The arrow is positioned beyond all projection lines, making it easy to see even on cluttered charts and reminding you of the current statistical bias without text.
6. Origin Marker
A small horizontal mark is drawn at the open of the current candle.
This acts as the “starting point” from which all ATR-based expansions above and below are measured.
7. Dashboard Panel
A compact dashboard is drawn in a corner of the chart (location configurable). It displays:
• Bullish Strength – combined normalized probability for upside expansions
• Bearish Strength – combined normalized probability for downside expansions
• Bias – “Long Bias”, “Short Bias”, or “Neutral”
• Trend Filter – shows whether EMA-based filtering is ON or OFF and which length is used
This gives you a quick, text-based summary of the current statistical environment.
█ SETTINGS
Analysis Lookback Period
• Controls how many historical bars the script inspects when searching for similar candles.
• Larger values = more history, smoother statistics, slower adaptation.
• Smaller values = faster adaptation, but more noise and less stability.
ATR Length
• The period used to compute ATR volatility.
• Defines how “big” 0.5 ATR and 1.0 ATR moves are on your current symbol and timeframe.
Trend Filter (EMA)
• Filter by Trend?
• When ON, only historical candles in a similar trend regime are used.
• When OFF, all past candles with similar color are considered, regardless of trend.
• Trend EMA Length
• EMA period used to classify trend.
• Price above EMA → uptrend environment.
• Price below EMA → downtrend environment.
This filter helps you separate behavior in uptrends from downtrends, which can significantly change breakout dynamics.
Visual Settings
• Projection Width (bars)
• How far the lines and zones extend into the future.
• Show Probability Zones
• Toggle shaded bands between each pair of levels.
• Label Size
• Choose smaller or larger text for the probability labels on the right.
• Tint Background by Bias
• Turn the bias-based background on or off.
• Show Bias Marker on Last Candle
• Toggle the up/down arrow marker.
• Dashboard Location
• Select top/bottom left/right corner for the panel.
█ HOW TO USE IT
1. Start With the Dashboard
Look at Bullish Strength vs Bearish Strength:
• If bullish is clearly larger → environment statistically favors upside expansion.
• If bearish is clearly larger → environment statistically favors downside expansion.
• If they are close → treat the situation as Neutral; consider reducing position size or waiting for more clarity.
2. Use Levels as Dynamic Targets
The projected lines and zones can serve as:
• Profit targets based on typical expansion distance
• Logical regions for scaling out
• Areas where you expect price behavior to change (e.g., loss of momentum)
Short-term traders often focus on the nearer expansion levels, while swing traders may use the farther levels as extended targets.
3. Align With Trend (Optional)
With the trend filter ON:
• Prefer Long setups when price is above the EMA and bullish probabilities dominate.
• Prefer Short setups when price is below the EMA and bearish probabilities dominate.
With the filter OFF, you get pure color-plus-pattern statistics across the whole lookback, which can be useful if you deliberately trade counter-trend or range conditions.
4. Combine With Your Existing System
Dynamic Breakout Odds is best used as a confirmation and targeting layer:
• Combine it with structure (support/resistance, supply/demand, order blocks).
• Combine it with volume or orderflow tools if you use them.
• Use the probability zones to validate whether your planned target is realistic relative to recent volatility.
It is not designed to be a standalone “buy/sell” signal generator, but a statistical map around your entries.
█ PRACTICAL EXAMPLES
Example A – Bullish, Moderate Expansion Frequently Hit
• Bullish Strength significantly higher than Bearish Strength.
• The nearer upside level shows a strong historical hit rate.
Interpretation: similar setups often produce at least a moderate push upward before failing.
Use case: trade pullbacks in the direction of the bias, targeting the nearer upside projection as an initial take-profit.
Example B – Bearish, Deeper Downside Often Reached
• Bearish Strength clearly dominant.
• Both the nearer and farther downside levels show decent probabilities.
Interpretation: similar conditions historically saw follow-through to the downside.
Use case: use rallies against the direction of the bias to position into shorts, planning partial exits around the first downside projection and runners toward the second.
Example C – Neutral, Balanced Probabilities
• Bullish and Bearish Strength scores are close.
• Background tint is very light or absent.
Interpretation: the market is statistically indecisive; expansions up or down are similarly likely.
Use case: consider range trading tactics, mean-reversion ideas, or simply standing aside until a clearer skew develops.
█ BEST PRACTICES
• Use on liquid symbols and reasonable timeframes to avoid distorted ATR behavior.
• Don’t overfit lookback length to a single instrument; test across markets.
• Let the indicator provide context, not absolute certainty.
• Always combine with proper risk management (position sizing, max loss per trade, etc.).
• Be cautious with very small sample sizes (e.g., very short lookbacks on low-volume assets).
█ LIMITATIONS & NOTES
• All probabilities are based on historical behavior; markets can change regime.
• ATR distances are relative to recent volatility and may shrink/expand over time.
• The script intentionally does not guarantee any direction or target; it only reports what has been most common in similar past situations.
█ DISCLAIMER
This tool is for educational and informational purposes only.
It does not constitute financial advice or a guarantee of performance.
Always do your own research, test on demo or historical data, and use appropriate risk management when trading live capital.
Protected script
This script is published as closed-source. However, you can use it freely and without any limitations – learn more here.
Disclaimer
The information and publications are not meant to be, and do not constitute, financial, investment, trading, or other types of advice or recommendations supplied or endorsed by TradingView. Read more in the Terms of Use.