OPEN-SOURCE SCRIPT
Multi-data oscillator
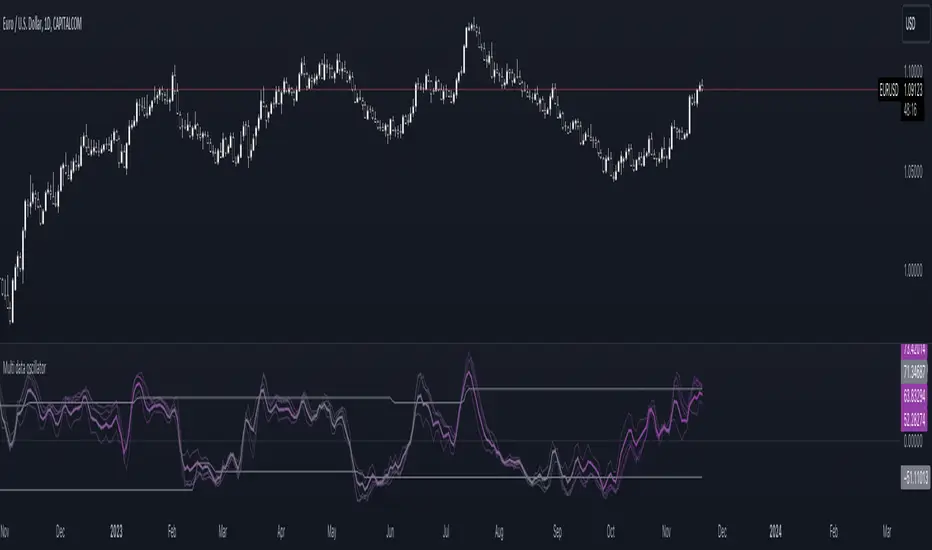
The multi-data oscillator is a tool created to help traders visualize clearly how an oscillator works and moves considering different input parameters.
In this tool, you can choose to visualize the script as the RSI, the CCI, the LOC indicator, a custom-created formula that simply shows the location of the data considering X past values, or the average of all of these three indicators.
In the settings, you can choose both the length of the indicator and the smoothing factor.
Additionally, the indicator has a gradient color that changes considering the deviation and the variance of the different lines used to calculate the average line, displayed with more thickness.
Open-source script
In true TradingView spirit, the creator of this script has made it open-source, so that traders can review and verify its functionality. Kudos to the author! While you can use it for free, remember that republishing the code is subject to our House Rules.
Disclaimer
The information and publications are not meant to be, and do not constitute, financial, investment, trading, or other types of advice or recommendations supplied or endorsed by TradingView. Read more in the Terms of Use.