ATR Threshold Measure
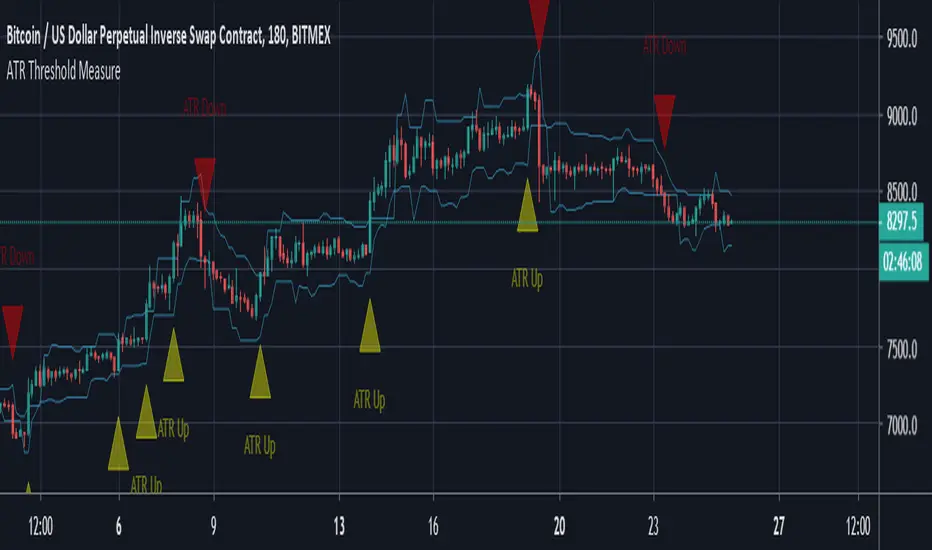
Each plot for upper and lower threshold is based on the difference in price between the open and close of the last consecutive candle sequence then divided by the number of ATRs set by the indicator to verify if price has indeed closed above or below it. Setting alerts to bar candle close only will prevent false alerts mid candles.
A quick bearish example of this would be if you had 4 consecutive red candles. The indicator will take the open of the first candle of the sequence and subtract the current close value from the current candle. It will then take that difference and determine how many ATRs price has moved based on the ATR of the original candle in the sequence(Not the current ATR). If the close of the current candle exceeds the threshold set in the settings an alert is given to notify the user of an increase of volatility in the market in the opposite direction of trend or continuation of trend in a high volatility manner.
Invite-only script
Only users approved by the author can access this script. You'll need to request and get permission to use it. This is typically granted after payment. For more details, follow the author's instructions below or contact XenoAwake directly.
TradingView does NOT recommend paying for or using a script unless you fully trust its author and understand how it works. You may also find free, open-source alternatives in our community scripts.
Author's instructions
Disclaimer
Invite-only script
Only users approved by the author can access this script. You'll need to request and get permission to use it. This is typically granted after payment. For more details, follow the author's instructions below or contact XenoAwake directly.
TradingView does NOT recommend paying for or using a script unless you fully trust its author and understand how it works. You may also find free, open-source alternatives in our community scripts.