PROTECTED SOURCE SCRIPT
Updated FLAME | Digital Levels

FLAME Indicator Explanation:
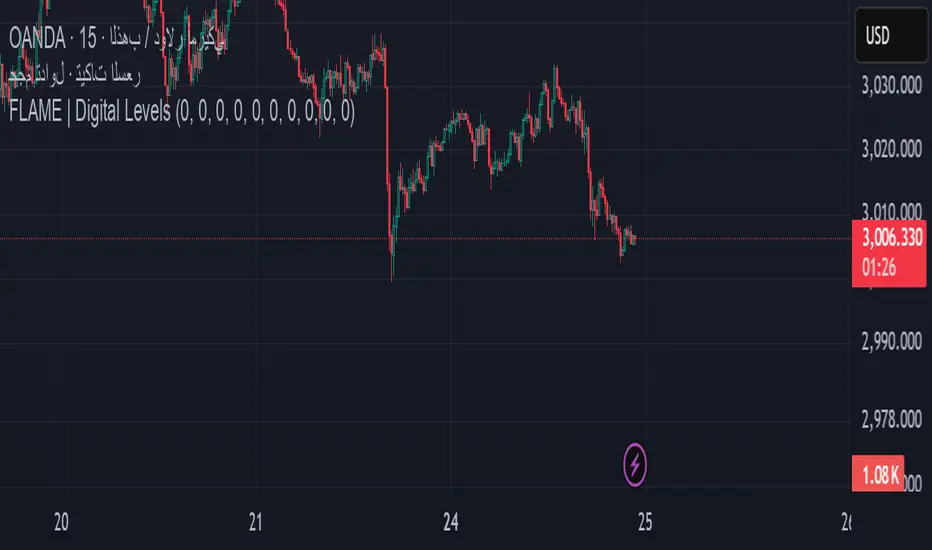
The FLAME Indicator aims to help you identify dynamic support and resistance levels on the chart. The indicator is based on horizontal lines set by the user, and their color changes depending on whether the price is at or above these lines (support) or below them (resistance). Here's a detailed explanation of each part of the indicator:
1. User Inputs:
The indicator allows you to customize 10 horizontal lines on the chart, with each line having a specific value and color.
Lines: You can define 10 horizontal lines on the chart with a specific value. For example, line1 can be at a value of 3055, and line2 at 3040, etc.
Colors: You can customize the color of each line individually. For example, line1 could be blue, line2 red, and so on.
2. How Alerts Work:
If the candle touches any of the defined lines within the tolerance margin, an alert is triggered, and a message is sent containing:
The name of the asset.
The line that was touched.
The designated link.
3. The Indicator in Action:
When you open the chart, you will see colored lines on the chart.
When the price touches these lines, the lines' colors will change based on whether they represent support or resistance.
You will receive alerts when this happens, allowing you to monitor the markets more accurately.
Conclusion:
The FLAME Indicator is a powerful tool for identifying support and resistance levels on the chart. By using this indicator, you can customize the lines with different colors and receive real-time alerts when the price touches these levels. This helps in making well-informed trading decisions based on clear technical analysis.
Release Notes
updateKey Features of the Indicator
✅ Automatically plots support and resistance levels.
✅ Changes the line color to green if it acts as support.
✅ Sends an alert only when the level is touched.
✅ Easy to use and manually adjustable.
User Input for Price Levels
The user manually defines 10 price levels (such as key support and resistance zones).
The color of each line can be customized in the settings.
Drawing Levels on the Chart
Each line is plotted on the chart, and its color changes to green if the price closes above it (indicating support).
Detecting Price Touch on Levels
If the price (High or Low) touches any of the defined lines, an alert is triggered.
The alert specifies the asset symbol and the exact level touched.
تحديث update
المزايا الأساسية للمؤشر
✅ يرسم مستويات دعم ومقاومة تلقائيًا.
✅ يغير لون الخط إلى الأخضر إذا كان دعمًا.
✅ يرسل تنبيه فقط عند لمس المستوى
✅ سهل الاستخدام وقابل للتعديل يدويًا
إدخال المستخدم للمستويات السعرية
المستخدم يحدد 10 خطوط سعرية (مثل مستويات الدعم والمقاومة المهمة) يدويًا
يمكن تغيير لون كل خط يدويًا من الإعدادات.
رسم المستويات على الرسم البياني
يتم رسم كل خط على الشارت مع تغيير لونه إلى الأخضر إذا كان السعر مغلقًا فوقه (يعمل كدعم).
اكتشاف ملامسة السعر للمستويات
إذا لمس السعر (High أو Low) أي من الخطوط المحددة، يتم إرسال تنبيه.
التنبيه يحدد رمز العملة والمستوى الذي تم لمسه.
Protected script
This script is published as closed-source. However, you can use it freely and without any limitations – learn more here.
Disclaimer
The information and publications are not meant to be, and do not constitute, financial, investment, trading, or other types of advice or recommendations supplied or endorsed by TradingView. Read more in the Terms of Use.