OPEN-SOURCE SCRIPT
Updated XAU 0/5 Grid
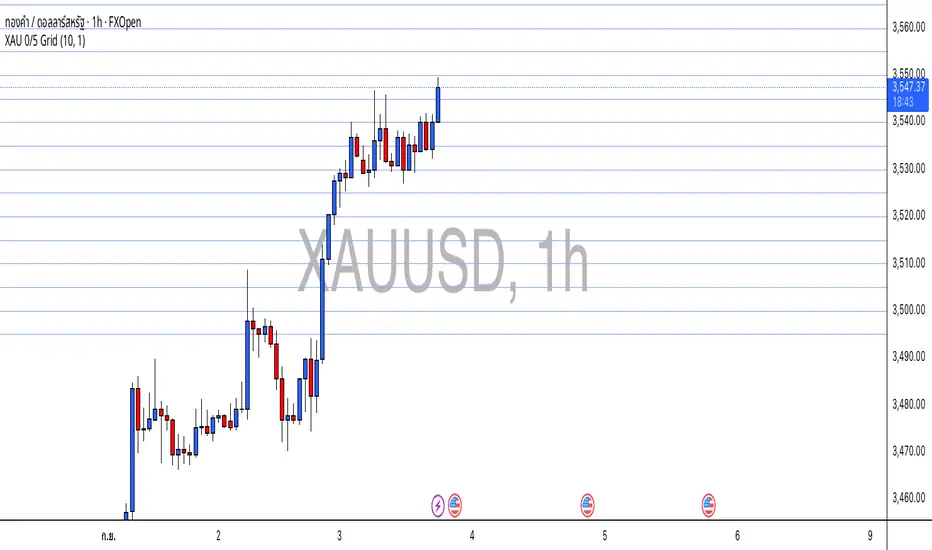
This indicator draws horizontal price grids for XAUUSD. It anchors the grid to a base price that ends with 0 or 5, then plots equally spaced levels every 5 price units above and below that base. It’s a clean way to eyeball fixed-interval structure for rough support/resistance zones and simple TP/SL planning.
How it works
Base (0/5):
base = floor(close / 5) × 5 → forces the base to always end with 0/5.
Grid levels:
level_i = base + i × 5, where i is any integer (positive/negative).
The script updates positions only when the base changes to avoid flicker and reduce chart load.
It uses a persistent line array to manage the line objects efficiently.
Usage
Add the indicator to an XAUUSD chart on any timeframe.
Configure in the panel:
Show Lines – toggle visibility
Lines each side – number of lines above/below the base
Line Color / Line Width – appearance
Use the grid as fixed reference levels (e.g., 3490, 3495, 3500, 3505, …) for planning TP/SL or observing grid breaks.
Highlights
Strict 0/5 anchoring keeps levels evenly spaced and easy to read on gold.
Auto-reanchors when price moves to a new 0/5 zone, maintaining a steady view.
Lightweight design: lines are created once and then updated, minimizing overhead.
Limitations
Visualization only — not a buy/sell signal.
Spacing is fixed at 5 price units, optimized for XAUUSD. If used on other symbols/brokers with different tick scales, adjust the logic accordingly.
Grid lines do not guarantee support/resistance; always combine with broader market context.
Release Notes
fix bugRelease Notes
fix bugOpen-source script
In true TradingView spirit, the creator of this script has made it open-source, so that traders can review and verify its functionality. Kudos to the author! While you can use it for free, remember that republishing the code is subject to our House Rules.
Disclaimer
The information and publications are not meant to be, and do not constitute, financial, investment, trading, or other types of advice or recommendations supplied or endorsed by TradingView. Read more in the Terms of Use.
Open-source script
In true TradingView spirit, the creator of this script has made it open-source, so that traders can review and verify its functionality. Kudos to the author! While you can use it for free, remember that republishing the code is subject to our House Rules.
Disclaimer
The information and publications are not meant to be, and do not constitute, financial, investment, trading, or other types of advice or recommendations supplied or endorsed by TradingView. Read more in the Terms of Use.