OPEN-SOURCE SCRIPT
Point and Figure on Candlestick Chart
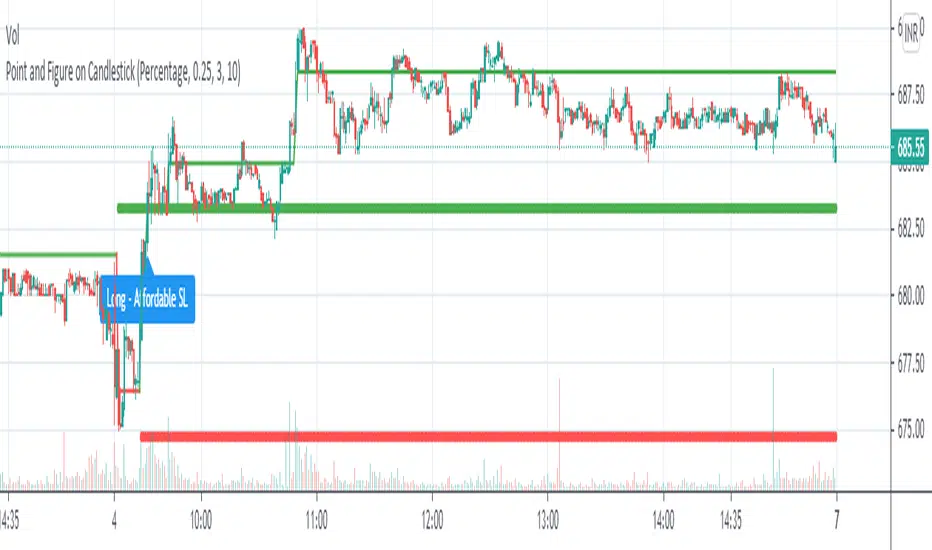
Live plotting of Point and Figure chart on a candlestick chart. With its own construction engine, it plot "X" and "O" column using a line chart. It plots the "X" column with green color and the "O" column with red color. Color of the line chart change from green to red when the column reversed from "X" to "O". It plot "Double Top Buy" and "Double Bottom Sell" level which help to do candlestick pattern analysis along with Point and Figure chart. Works on all timeframes with given parameters.
Options :
Box Size Assignment Method : Select a method to construct Point and Figure chart. There are two options "Fix" and "Percentage". The default value is "Percentage".
Box Size : The size of box. Minimum price movement to plot a new box. Smaller box size shows greater price movement and Bigger box size shows more filtered price movement compare to smaller box size. The default value is "0.25%"
Reversal Size : Minimum boxes required for column reversal. The default value is "3".
Stoploss Size In Box : To get affordable trade give the number of boxes for stop loss.
Open-source script
In true TradingView spirit, the creator of this script has made it open-source, so that traders can review and verify its functionality. Kudos to the author! While you can use it for free, remember that republishing the code is subject to our House Rules.
Disclaimer
The information and publications are not meant to be, and do not constitute, financial, investment, trading, or other types of advice or recommendations supplied or endorsed by TradingView. Read more in the Terms of Use.