Goldbach Energy Curve
Precision phase-energy detection for professional traders
The Goldbach Energy Curve transforms raw market motion into a smooth, color-coded energy profile — revealing when price transitions between Accumulation, Manipulation, and Distribution states.
It blends advanced filtering with adaptive energy mapping to visualize market compression and expansion cycles in real time.
Use it to sense when momentum is building, fading, or rotating across phases — before structure or volume confirms the shift.
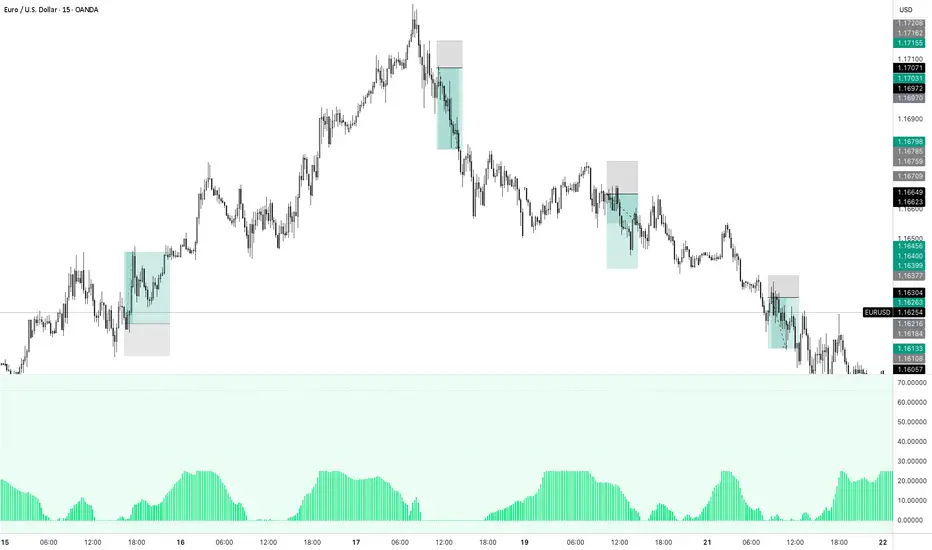
⚙️ How to Read the Energy Curve
Below 10 → Ultra-Low Energy Zone
Market in deep Accumulation — liquidity builds, volatility compresses, and smart money positions quietly.
10 – 33 → Rising Accumulation
Early signs of energy release; watch for breakout or expansion setups.
33 – 66 → Manipulation Phase
Transitional zone; expect false moves, liquidity grabs, and short-term volatility spikes.
Above 66 → Distribution Phase
Energy peaks — trend exhaustion, reversals, or large-scale profit-taking often emerge.
Align your directional bias with the market’s current energy state, from silent buildup to full distribution.
Features
Dynamic A / M / D phase tracking
Smooth histogram with adaptive curve overlay
Automatic background shading for instant context
Non-repainting and optimized for multi-timeframe analysis
Ideal for:
Institutional-style traders who value precision, clarity, and early insight into phase rotations.
Invite-only script
Only users approved by the author can access this script. You'll need to request and get permission to use it. This is typically granted after payment. For more details, follow the author's instructions below or contact zacdivan directly.
TradingView does NOT recommend paying for or using a script unless you fully trust its author and understand how it works. You may also find free, open-source alternatives in our community scripts.
Author's instructions
Disclaimer
Invite-only script
Only users approved by the author can access this script. You'll need to request and get permission to use it. This is typically granted after payment. For more details, follow the author's instructions below or contact zacdivan directly.
TradingView does NOT recommend paying for or using a script unless you fully trust its author and understand how it works. You may also find free, open-source alternatives in our community scripts.