OPEN-SOURCE SCRIPT
The Rumer's Box Theory
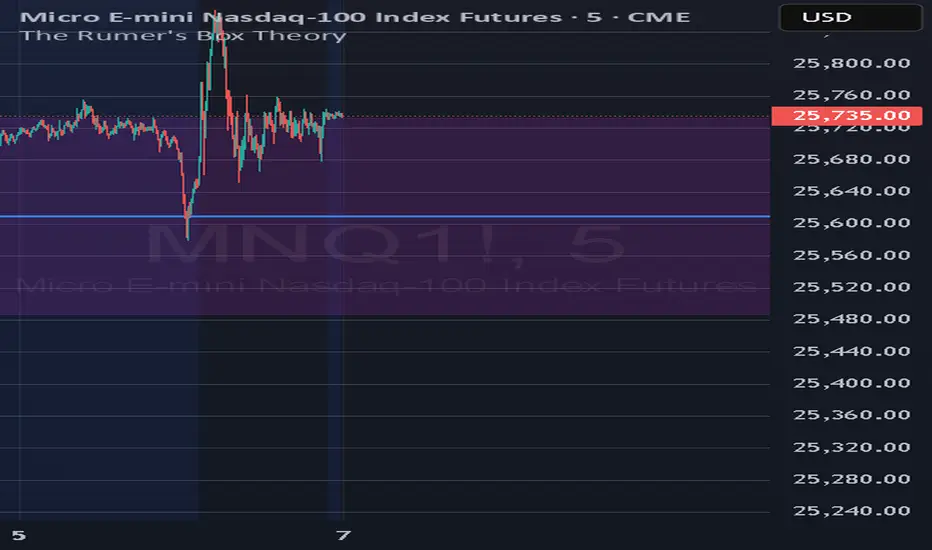
“The Rumer's Box Theory” is a visual trading indicator that allows traders to quickly identify the previous daily candle’s high and low across any timeframe. It displays a purple box spanning the previous day’s high to low, with a blue horizontal line marking the 50% midpoint for quick reference. The settings also provide options to extend the box and midpoint line to the left, giving traders flexibility in how the indicator appears on the chart.
Open-source script
In true TradingView spirit, the creator of this script has made it open-source, so that traders can review and verify its functionality. Kudos to the author! While you can use it for free, remember that republishing the code is subject to our House Rules.
Disclaimer
The information and publications are not meant to be, and do not constitute, financial, investment, trading, or other types of advice or recommendations supplied or endorsed by TradingView. Read more in the Terms of Use.