DASM MACD
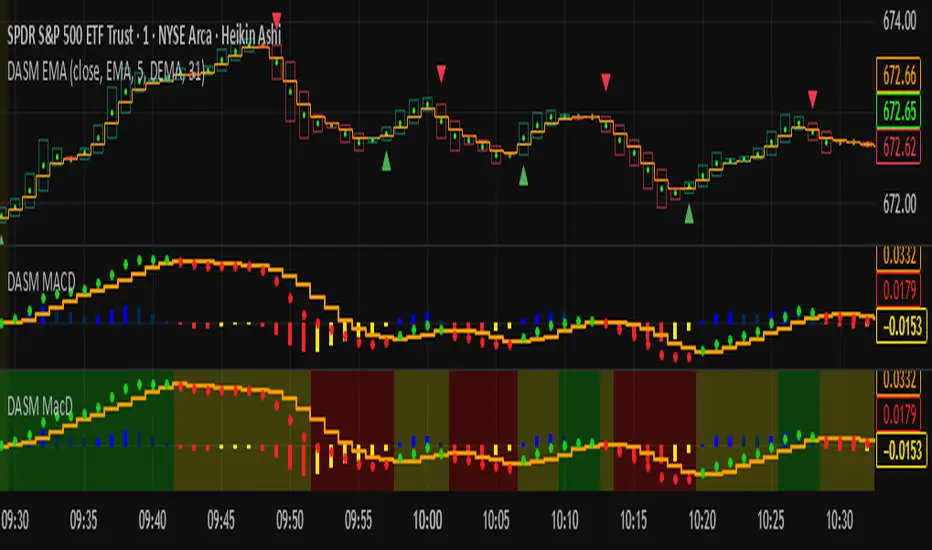
- The main trend is bullish when the MACD is above the zero line, and bearish when it’s below.
- The histogram shows when a trend starts and when it’s losing strength.
- The background color highlights the trend direction.
- The EMA is easy to read — green means buy, red means sell.
Invite-only script
Only users approved by the author can access this script. You'll need to request and get permission to use it. This is typically granted after payment. For more details, follow the author's instructions below or contact DASMCODE directly.
TradingView does NOT recommend paying for or using a script unless you fully trust its author and understand how it works. You may also find free, open-source alternatives in our community scripts.
Author's instructions
Disclaimer
Invite-only script
Only users approved by the author can access this script. You'll need to request and get permission to use it. This is typically granted after payment. For more details, follow the author's instructions below or contact DASMCODE directly.
TradingView does NOT recommend paying for or using a script unless you fully trust its author and understand how it works. You may also find free, open-source alternatives in our community scripts.