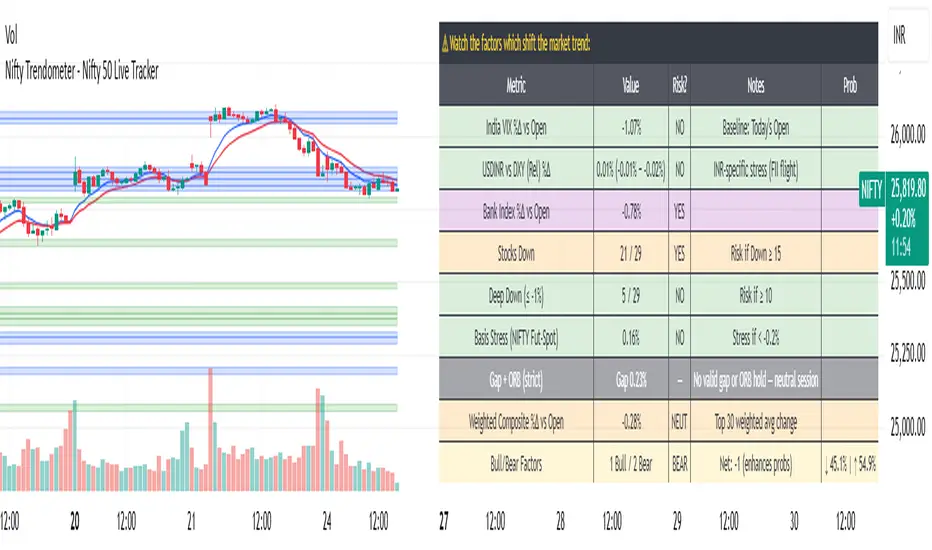
Nifty Trendometer - Nifty 50 Live Tracker
🔍 One glance, total clarity. One tool, total control.
The Nifty Trendometer is a next-generation TradingView indicator designed for serious traders and portfolio managers who want to see what institutions see. It merges advanced demand–supply analytics, live breadth monitoring, and macro stress signals — all in one clean, self-updating dashboard.
🧭 What It Does?
Tracks Nifty 50 internals live: See how many of India’s top 30 stocks are gaining, losing, or collapsing beyond key thresholds.
Identifies actionable demand and supply zones: The algorithm automatically scans for low-volume demand zones, supply imbalances, and high-volume consolidation clusters (HVNs) — letting you spot where smart money is active.
Generates precision buy/sell decisions: Smart zone-touch detection coupled with real-time volume validation gives you high-confidence reversal or breakout signals — without repainting.
Measures macro risk instantly: Integrated India VIX, USDINR, Bank Index, and Basis stress readings tell you when the market’s underlying engine is overheating or calming down.
⚡ Key Highlights
✅ Dynamic Zone Mapping — Automatically highlights fresh demand (green), supply (purple), and HVN (blue) regions as they form — no manual drawing needed.
✅ Smart Volume Logic — Detects price reactions backed by significant volume surges — confirming genuine breakouts, not noise.
✅ Crash & Rally Detector — A proprietary “Crash Probability” engine calculates live risk and momentum balance, showing how close the market is to tipping into panic or breakout.
✅ ORB & Gap Analysis — Monitors intraday open-range breakouts, gap fades, and continuation patterns with volatility confirmation.
✅ Macro Stress Dashboard — Instantly shows whether India’s market risk is local, global, or liquidity-driven — using DXY-relative INR movement, bank index health, and basis stress.
✅ Smart Alerts — Be notified automatically when the system detects:
• Crash Symptoms (Warning)
• Crash Confirmation (Crisis)
• Rally Watch
• Rally Start (Go Signal)
🧠 The Logic — Simplified
The Trendometer combines the following:
Volume profile geometry (for hidden demand/supply zones)
Price reaction mapping (for confirmed reversals and rejections)
Multi-factor stress scoring (VIX, currency, banks, basis, and breadth)
Probability modeling (a smooth blend of seven risk dimensions, scaled to a live “Crash–Rally Probability” score)
Everything updates tick-by-tick, producing a dynamic, data-driven market weather report.
📊 One Dashboard, Infinite Insight
The indicator creates a compact, color-coded table on your TradingView chart showing:
VIX % change
USDINR strength (absolute or DXY-relative)
Bank index trend
Nifty breadth and depth (number of stocks down / deeply down)
Basis stress (futures vs spot)
ORB/gap behavior
Overall crash or rally probability (e.g., “↓ 68% | ↑ 32%”)
Visual cues instantly shift from green (safe) to orange (watch) to red (crisis) — no guessing required.
💡 Ideal For:
Intraday traders seeking early directional bias confirmation
Swing traders spotting reversals at demand/supply pivots
Investors wanting macro stress signals before volatility spikes
Quant-oriented analysts tracking multi-factor market health
⚙️ Plug-and-Trade Simplicity
Just add the Nifty Trendometer to your TradingView chart and watch the market structure, sentiment, and institutional footprints reveal themselves in real time.
No parameter tuning. No manual drawing. No data delays.
📈 Nifty Trendometer — When precision meets perspective.
Because the best traders don’t predict — they measure the factors which affect the market.
Invite-only script
Only users approved by the author can access this script. You'll need to request and get permission to use it. This is typically granted after payment. For more details, follow the author's instructions below or contact jellygill directly.
TradingView does NOT recommend paying for or using a script unless you fully trust its author and understand how it works. You may also find free, open-source alternatives in our community scripts.
Author's instructions
Telegram: @jellygill
Our Telegram Channel: @CheetaTrader
join to complete FREE TRAINING on how to use the indicators effectively and then request @jellygill for FREE TRIAL
Disclaimer
Invite-only script
Only users approved by the author can access this script. You'll need to request and get permission to use it. This is typically granted after payment. For more details, follow the author's instructions below or contact jellygill directly.
TradingView does NOT recommend paying for or using a script unless you fully trust its author and understand how it works. You may also find free, open-source alternatives in our community scripts.
Author's instructions
Telegram: @jellygill
Our Telegram Channel: @CheetaTrader
join to complete FREE TRAINING on how to use the indicators effectively and then request @jellygill for FREE TRIAL