OPEN-SOURCE SCRIPT
Updated Intra-variety Timeframe Floating Fibonacci Levels [Loxx]
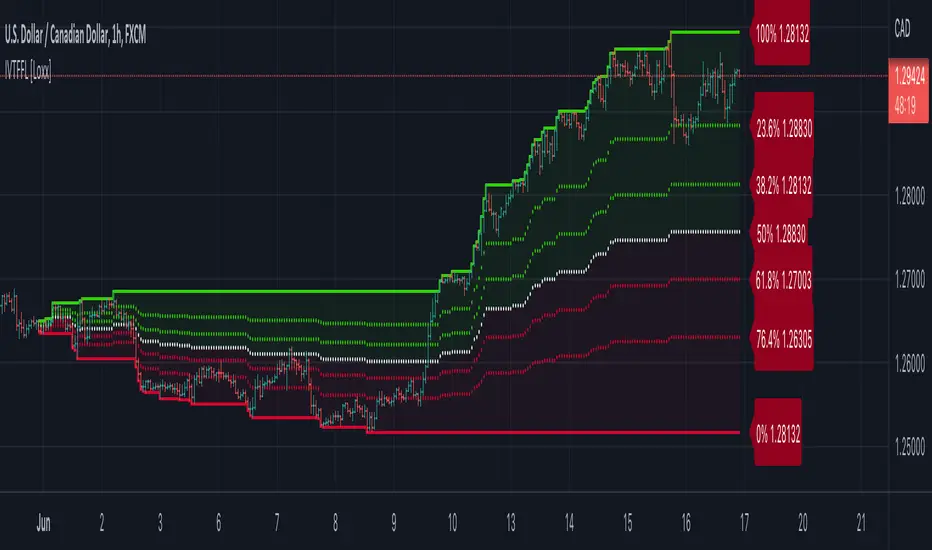
Intra-variety Timeframe Floating Fibonacci Levels [Loxx] is an intraday, intraweek, and intramonth indicator to be used for scalping on lower timeframes. The indicator paints the developing fibonacci retracement levels as they change overtime over the selected intra-variety timeframe chosen. This indicator acts as another way to gauge support and resistance levels.
What Are Fibonacci Retracement Levels?
Fibonacci retracement levels—stemming from the Fibonacci sequence—are horizontal lines that indicate where support and resistance are likely to occur.
Each level is associated with a percentage. The percentage is how much of a prior move the price has retraced. The Fibonacci retracement levels are 23.6%, 38.2%, 61.8%, and 78.6%. While not officially a Fibonacci ratio, 50% is also used.
The indicator is useful because it can be drawn between any two significant price points, such as a high and a low. The indicator will then create the levels between those two points.
Suppose the price of a stock rises $10 and then drops $2.36. In that case, it has retraced 23.6%, which is a Fibonacci number. Fibonacci numbers are found throughout nature. Therefore, many traders believe that these numbers also have relevance in financial markets.
Fibonacci retracement levels were named after Italian mathemetician Leonardo Pisano Bigollo, who was famously known as Leonardo Fibonacci. However, Fibonacci did not create the Fibonacci sequence. Fibonacci, instead, introduced these numbers to western Europe after learning about them from Indian merchants. Fibonacci retracement levels were formulated in Ancient India between 450 and 200 BCE.
Details
-Change Fibonacci levels
-Select day, week, or month timeframe
Release Notes
Updated rulesRelease Notes
Quick update for those who get an error message. Here's how you deal with errors. You have to make sure you're on an approved timeframe otherwise the indicator won't work. Open-source script
In true TradingView spirit, the creator of this script has made it open-source, so that traders can review and verify its functionality. Kudos to the author! While you can use it for free, remember that republishing the code is subject to our House Rules.
Public Telegram Group, t.me/algxtrading_public
VIP Membership Info: patreon.com/algxtrading/membership
VIP Membership Info: patreon.com/algxtrading/membership
Disclaimer
The information and publications are not meant to be, and do not constitute, financial, investment, trading, or other types of advice or recommendations supplied or endorsed by TradingView. Read more in the Terms of Use.
Open-source script
In true TradingView spirit, the creator of this script has made it open-source, so that traders can review and verify its functionality. Kudos to the author! While you can use it for free, remember that republishing the code is subject to our House Rules.
Public Telegram Group, t.me/algxtrading_public
VIP Membership Info: patreon.com/algxtrading/membership
VIP Membership Info: patreon.com/algxtrading/membership
Disclaimer
The information and publications are not meant to be, and do not constitute, financial, investment, trading, or other types of advice or recommendations supplied or endorsed by TradingView. Read more in the Terms of Use.