PROTECTED SOURCE SCRIPT
Multi Triple EMA Crossover [Salamun]
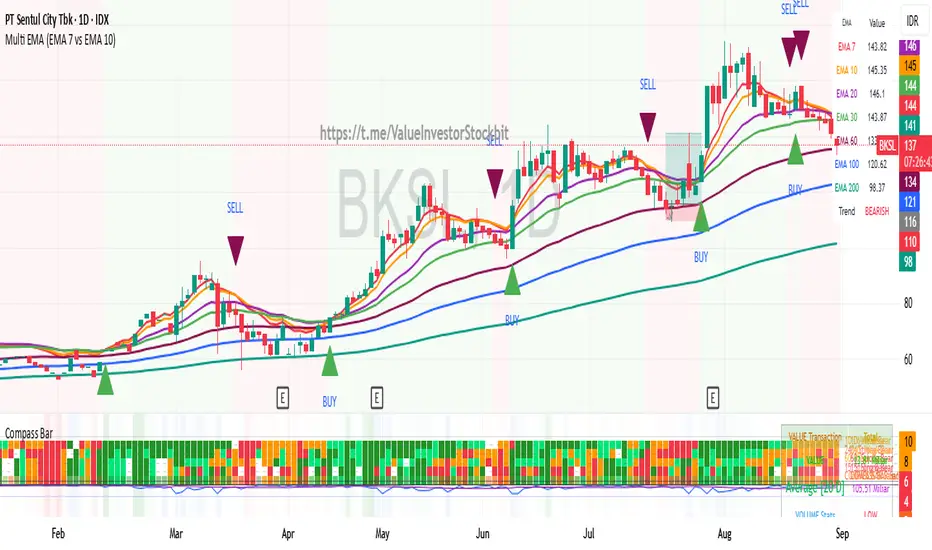
Multi EMA Crossover Indicator Function:
1. Identifying Trends:
Short EMA (7, 10, 20) for short term trend
Intermediate EMA (30, 60, 100) for intermediate trends
Long EMA (200) for long term trend
The shorter the EMA period, the more sensitive it is to price changes.
2. Providing Entry/Exit Signals:
Green Arrow (BUY) : When fast EMA crosses above slow EMA = bullish momentum
Red Arrow (SELL) : When the fast EMA crosses below the slow EMA = bearish momentum
How to Read Indicators:
✅ Bullish Condition:
Price is above the majority of EMA
The short EMA is above the long EMA
Light green background
A green arrow appears.
❌ Bearish Condition:
Price is below the majority of EMA
The short EMA is below the long EMA
Pink background
A red arrow appears
📊 Tips Trading:
Trend confirmation : Make sure the EMAs are in sequence (EMA7 > EMA10 > EMA20 for uptrend)
Support/Resistance : EMA can function as dynamic support/resistance
Signal filter : Use higher timeframe for confirmation
Risk management : Do not trade against the 200 EMA trend.
The table on the top right displays the real-time values of all EMAs and the current trend status for easy quick analysis.
Protected script
This script is published as closed-source. However, you can use it freely and without any limitations – learn more here.
Disclaimer
The information and publications are not meant to be, and do not constitute, financial, investment, trading, or other types of advice or recommendations supplied or endorsed by TradingView. Read more in the Terms of Use.