OPEN-SOURCE SCRIPT
Updated [blackcat] L2 Gradient RSIVWAP
OVERVIEW
The [blackcat] L2 Gradient RSIVWAP indicator offers traders a powerful tool for assessing market conditions by combining Relative Strength Index (RSI) with Volume Weighted Average Price (VWAP). It features dynamic coloring and clear buy/sell signals to enhance decision-making.
[FEATURES]
Customizable Inputs: Adjust key parameters such as RSI-VWAP length, oversold/overbought levels, and smoothing period.
Gradient Color Visualization: Provides intuitive gradient coloring to represent RSI-VWAP values.
Buy/Sell Indicators: On-chart labels highlight potential buying and selling opportunities.
Transparent Fills: Visually distinguishes overbought and oversold zones without obscuring other data.
[HOW TO USE]
Access the TradingView platform and select the chart where you wish to implement the indicator.
Go to “Indicators” in the toolbar and search for “[blackcat] L2 Gradient RSIVWAP.”
Click “Add to Chart” to integrate the indicator into your chart.
Customize settings via the input options:
Toggle between standard RSI and RSI-based VWAP.
Set preferred lengths and thresholds for RSI-VWAP calculations.
Configure the smoothing period for ALMA.
[LIMITATIONS]
Performance can vary based on asset characteristics like liquidity and volatility.
Historical backtests do not predict future market behavior accurately.
[NOTES]
The ALMA function, developed by Arnaud Legoux, enhances response times relative to simple moving averages.
Buy and sell signals are derived from RSI-VWAP crossovers; consider additional factors before making trades.
[THANKS]
Special thanks to Arnaud Legoux for creating the ALMA function.
Release Notes
OVERVIEW📈 [blackcat] L2 Gradient RSIVWAP is an innovative TradingView indicator that combines Relative Strength Index (RSI) calculations with Volume Weighted Average Price (VWAP). This script provides a unique perspective on market sentiment by applying RSI to VWAP, offering traders a powerful tool for identifying potential reversal points.
FEATURES
Customizable RSI-VWAP calculation
ALMA smoothing for reduced noise
Dynamic gradient coloring based on RSI-VWAP values
Visual representation of overbought and oversold conditions
Clear buy/sell signal labeling
Alert functionality for signal detection
HOW TO USE
Add the script to your TradingView chart.
Adjust input variables in the settings panel:
Use RSI Volume Weighted Average Price
RSI-VWAP Length
RSI-VWAP Oversold
RSI-VWAP Overbought
ALMA Smoothing Period
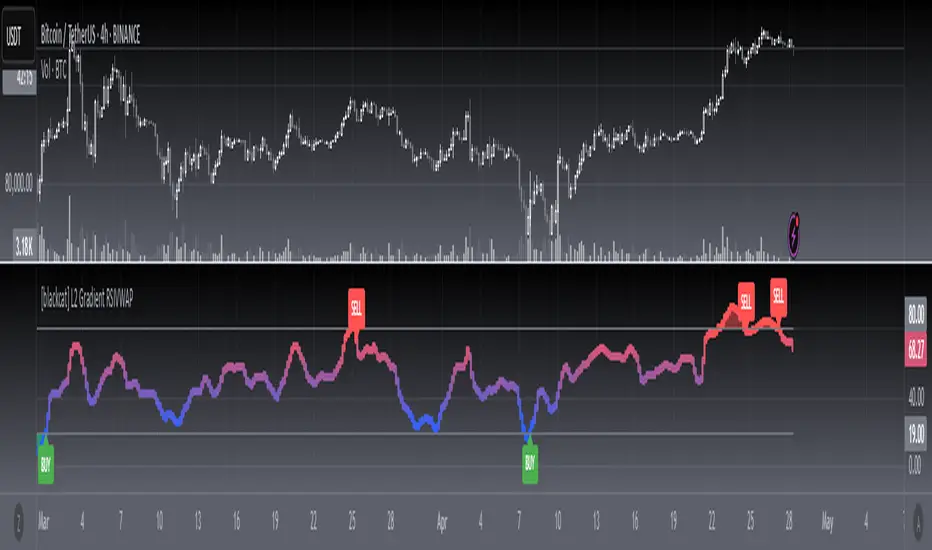
Observe the generated plots and signals on your chart:
Colored line representing Smoothed RSI-VWAP
Gray lines indicating overbought and oversold levels
Color-coded background for overbought/oversold zones
"BUY" and "SELL" labels at signal points
LIMITATIONS
Performance may vary across different markets and timeframes
The complexity of the indicator might be challenging for beginners
Requires proper understanding of RSI and VWAP concepts
NOTES
The script calculates RSI based on VWAP instead of standard price data
ALMA is used to smooth the RSI-VWAP line
Gradient coloring provides a visual representation of RSI-VWAP values
Signals are generated based on crossovers with overbought/oversold levels
THANKS
Special thanks to the TradingView community for their valuable feedback and contributions to this indicator's development.
Open-source script
In true TradingView spirit, the creator of this script has made it open-source, so that traders can review and verify its functionality. Kudos to the author! While you can use it for free, remember that republishing the code is subject to our House Rules.
Avoid losing contact!Don't miss out! The first and most important thing to do is to join my Discord chat now! Click here to start your adventure: discord.com/invite/ZTGpQJq 防止失联,请立即行动,加入本猫聊天群: discord.com/invite/ZTGpQJq
Disclaimer
The information and publications are not meant to be, and do not constitute, financial, investment, trading, or other types of advice or recommendations supplied or endorsed by TradingView. Read more in the Terms of Use.