OPEN-SOURCE SCRIPT
Zarattini Intra-day Threshold Bands (ZITB)
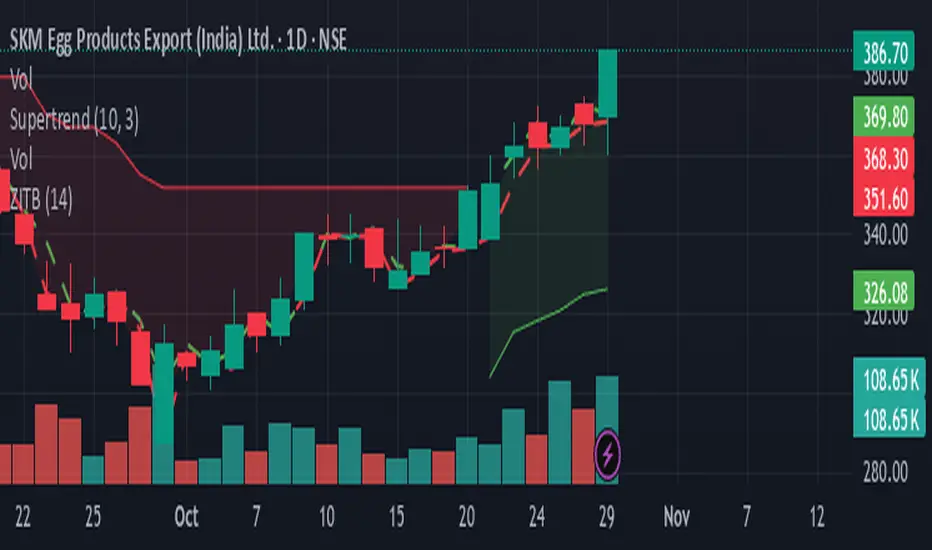
This indicator implements the intraday threshold band methodology described in the research paper by Carlo Zarattini et al.
Overview:
Plots intraday threshold bands based on daily open/close levels.
Supports visualization of BaseUp/BaseDown levels and Threshold Upper/Lower bands.
Optional shading between threshold bands for easier interpretation.
Usage Notes / Limitations:
Originally studied on SPY (US equities), this implementation is adapted for NSE intraday market timing, specifically the NIFTY50 index.
Internally, 2-minute candles are used if the chart timeframe is less than 2 minutes.
Values may be inaccurate if the chart timeframe is more than 1 day.
Lookback days are auto-capped to avoid exceeding TradingView’s 5000-bar limit.
The indicator automatically aligns intraday bars across multiple days to compute average deltas.
For better returns, it is recommended to use this indicator in conjunction with VWAP and a volatility-based position sizing mechanism.
Can be used as a reference for Open Range Breakout (ORB) strategies.
Customizations:
Toggle plotting of base levels and thresholds.
Toggle shading between thresholds.
Line colors and styles can be adjusted in the Style tab.
Intended for educational and research purposes only.
This indicator implements the approach described in the research paper by Zarattini et al.
Note: This implementation is designed for the NSE NIFTY50 index. While Zarattini’s original study was conducted on SPY, this version adapts the methodology for the Indian market.
Methodology Explanation
This indicator is primarily designed for Open Range Breakout (ORB) strategies.
Base Levels
BaseUp = Maximum of today’s open and previous day’s close
BaseDown = Minimum of today’s open and previous day’s close
Delta Calculation
For the past 14 trading days (lookbackDays), the delta for each intraday candle is calculated as the ab
solute difference from the close of the first candle of that day.
Average Delta
For a given intraday time/candle today, deltaAvg is computed as the average of the deltas at the same time across the previous 14 days.
Threshold Bands
ThresholdUp = BaseUp + deltaAvg
ThresholdDown = BaseDown − deltaAvg
Signals
Spot price moving above ThresholdUp → Long signal
Spot price moving below ThresholdDown → Short signal
Tip: For better returns, combine this indicator with VWAP and a volatility-based position sizing mechanism.
Open-source script
In true TradingView spirit, the creator of this script has made it open-source, so that traders can review and verify its functionality. Kudos to the author! While you can use it for free, remember that republishing the code is subject to our House Rules.
Gokul Ramachandran – software architect, programmer. Interested in trading and investment. Currently trading and researching strategies that can be employed in NSE.
Contact: gokul4trading@gmail.com]
LinkedIn: linkedin.com/in/gokulramachandran/
Contact: gokul4trading@gmail.com]
LinkedIn: linkedin.com/in/gokulramachandran/
Disclaimer
The information and publications are not meant to be, and do not constitute, financial, investment, trading, or other types of advice or recommendations supplied or endorsed by TradingView. Read more in the Terms of Use.