OPEN-SOURCE SCRIPT
Updated OBV's %B
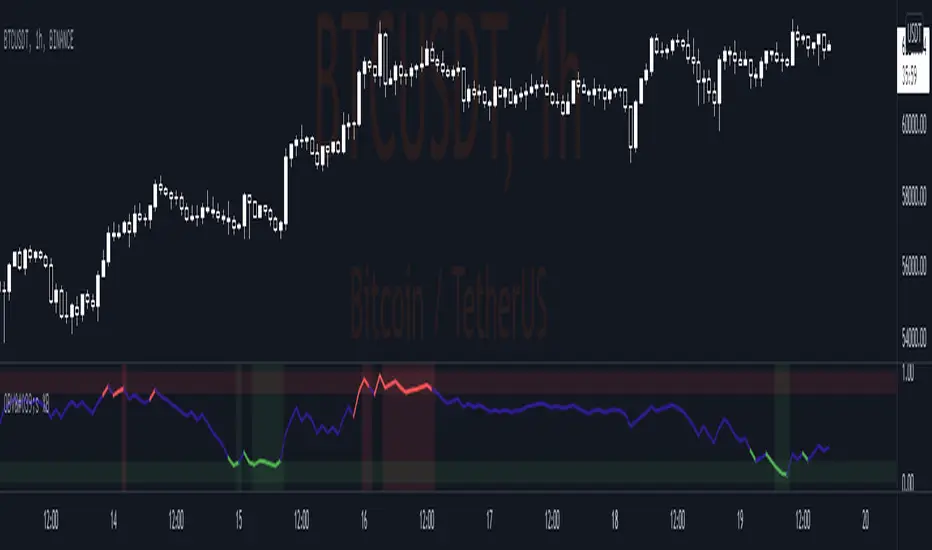
Indicator display where OBV (On Balance Volume) is in relation to the bands of Bollinger Bands (OBV,100,3)
A. OBV's Bb Info
1. Basis = SMA (OBV,100)
2. Upper Band = Basis + 3 x Standard Deviation
3. Lower Band = Basis - 3 x Standard Deviation
B. OBV's %B Info
1. %B Above 1 = OBV is Above the Upper Band
2. %B Below 0 = OBV is Below the Lower Band
3. %B Above 0.8 = OBV is Nearing the Upper Band
4. %B Below 0.20 = OBV is Nearing the Lower Band
Release Notes
* Update to Pine version 5* Add Signal Background
* Buy Signal:
- When obv inside Support Zone (0.0 - 0.2)
* Sell Signal:
- When obv inside Resistance Zone (0.8 - 1.0)
Open-source script
In true TradingView spirit, the creator of this script has made it open-source, so that traders can review and verify its functionality. Kudos to the author! While you can use it for free, remember that republishing the code is subject to our House Rules.
Disclaimer
The information and publications are not meant to be, and do not constitute, financial, investment, trading, or other types of advice or recommendations supplied or endorsed by TradingView. Read more in the Terms of Use.