Fear Greed zones and Money Waves Fused
Core Functions
- It calculates a zero-centered and smoothed version of the MFI (MoneyWave) using configurable smoothing methods (SMA, EMA, RMA) with parameters for length and smoothing intensity.
- It uses RSI to define fear and greed zones based on user-defined thresholds (e.g., RSI below 30 indicates fear, above 70 indicates greed).
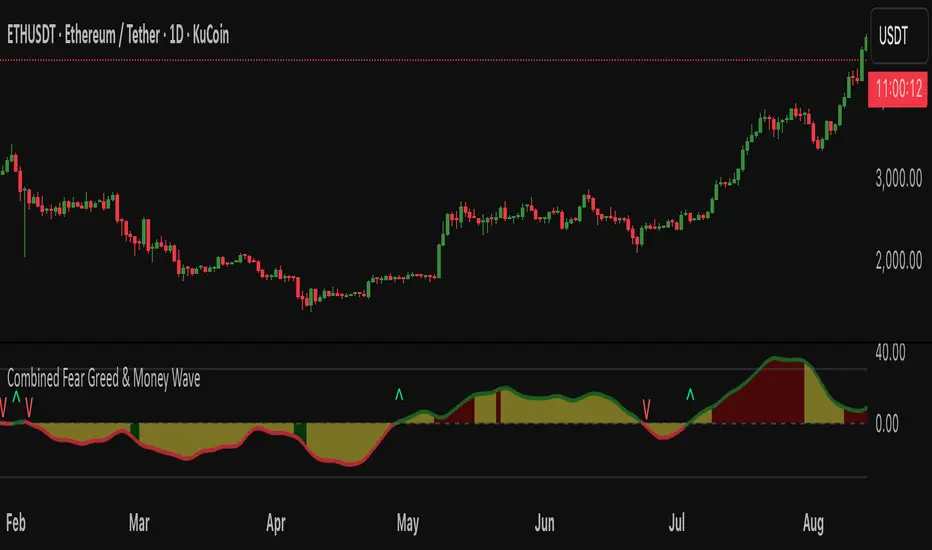
- The MoneyWave area is color-coded based on these fear/greed RSI zones: dark green for fear, dark red for greed, and yellow neutral.
- The edge line of the MoneyWave shows bullish (lime) when above zero and bearish (red) when below zero.
Visual Elements
- Plots the MoneyWave as a colored area with an edge line.
- Displays horizontal lines representing the zero line and upper/lower bounds derived from MFI thresholds.
- Optionally shows direction change arrows when the MoneyWave sign changes and labels indicating BUY or SELL signals based on MoneyWave crossing zero combined with fear/greed conditions.
Trading Signals and Alerts
- Buy signal triggers when MoneyWave crosses upward through zero while in the fear zone (RSI low).
- Sell signal triggers when MoneyWave crosses downward through zero while in the greed zone (RSI high).
- Alerts can be generated for these buy/sell events.
In summary, this indicator provides a combined measure of money flow momentum (MoneyWave) with market sentiment zones (fear and greed from RSI), helping identify potential market entry and exit points with visual markers and alerts [script].
Invite-only script
Only users approved by the author can access this script. You'll need to request and get permission to use it. This is typically granted after payment. For more details, follow the author's instructions below or contact Ifiok-Trades directly.
TradingView does NOT recommend paying for or using a script unless you fully trust its author and understand how it works. You may also find free, open-source alternatives in our community scripts.
Author's instructions
Disclaimer
Invite-only script
Only users approved by the author can access this script. You'll need to request and get permission to use it. This is typically granted after payment. For more details, follow the author's instructions below or contact Ifiok-Trades directly.
TradingView does NOT recommend paying for or using a script unless you fully trust its author and understand how it works. You may also find free, open-source alternatives in our community scripts.