OPEN-SOURCE SCRIPT
EMA Color Buy/Sell
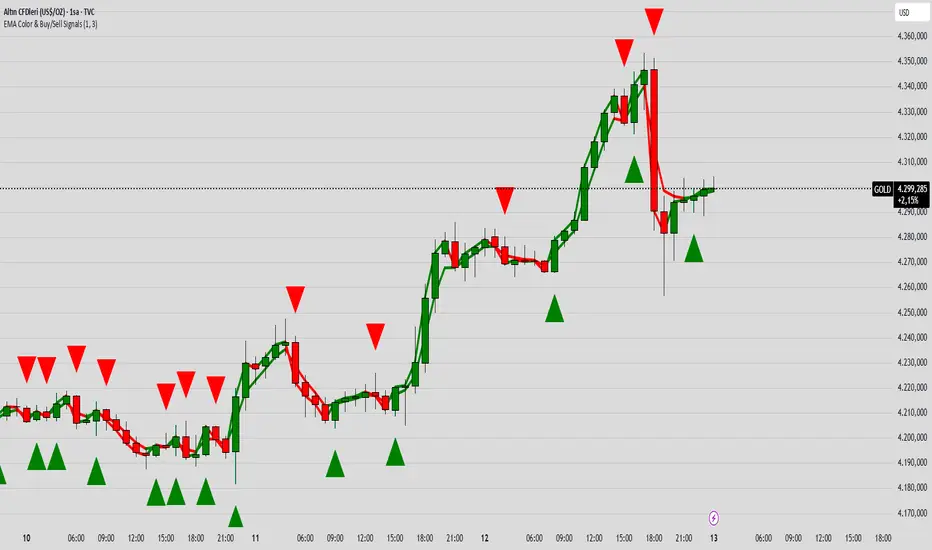
indicator("EMA Color & Buy/Sell Signals", overlay=true, max_lines_count=500, max_labels_count=500)
EMA
emaShortLen = input.int(9, "Kısa EMA")
emaLongLen = input.int(21, "Uzun EMA")
EMA
emaShort = ta.ema(close, emaShortLen)
emaLong = ta.ema(close, emaLongLen)
EMA renkleri (trend yönüne göre)
emaShortColor = emaShort > emaShort[1] ? color.green : color.red
emaLongColor = emaLong > emaLong[1] ? color.green : color.red
EMA
plot(emaShort, color=emaShortColor, linewidth=3, title="EMA Short")
plot(emaLong, color=emaLongColor, linewidth=3, title="EMA Long")
buySignal = ta.crossover(emaShort, emaLong)
sellSignal = ta.crossunder(emaShort, emaLong)
plotshape(buySignal, title="Buy", location=location.belowbar, color=color.lime, style=shape.triangleup, size=size.large)
plotshape(sellSignal, title="Sell", location=location.abovebar, color=color.red, style=shape.triangledown, size=size.large)
barcolor(close > open ? color.new(color.green, 0) : color.new(color.red, 0))
var line buyLine = na
var line sellLine = na
if buySignal
buyLine := line.new(bar_index, low, bar_index, high, color=color.lime, width=2)
if sellSignal
sellLine := line.new(bar_index, high, bar_index, low, color=color.red, width=2)
Open-source script
In true TradingView spirit, the creator of this script has made it open-source, so that traders can review and verify its functionality. Kudos to the author! While you can use it for free, remember that republishing the code is subject to our House Rules.
Disclaimer
The information and publications are not meant to be, and do not constitute, financial, investment, trading, or other types of advice or recommendations supplied or endorsed by TradingView. Read more in the Terms of Use.