OPEN-SOURCE SCRIPT
MTF OHLC stats
Big thanks to GhostTraderx1 for the original MTF OHLC code that was used to create the MTF ranges in this indicator
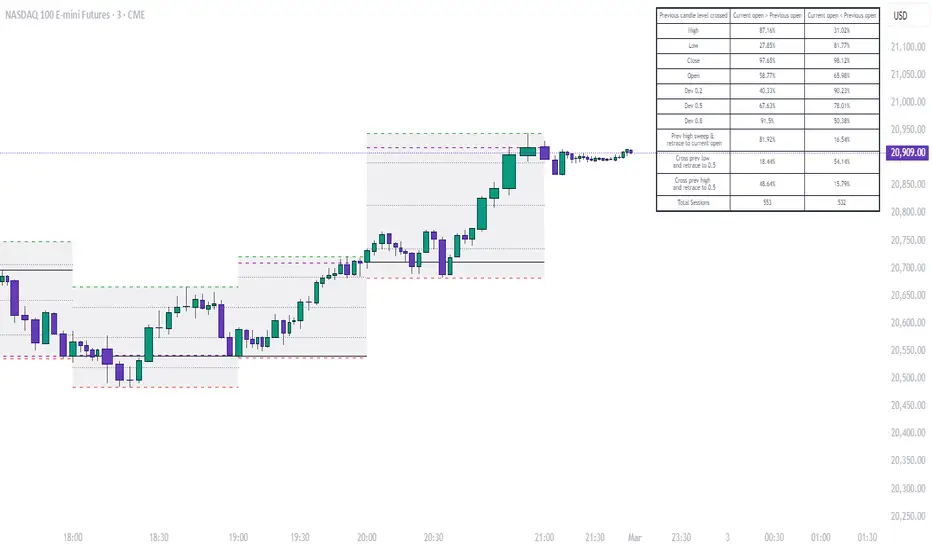
The MTF OHLC Stats indicator is a versatile tool designed to visualize and analyse price interactions with key levels from a previous candle across a user-defined timeframe. It plots the Open, High, Low, Close, and three intra-range deviation levels (0.2, 0.5, 0.8) from the prior candle, tracks how often price crosses these levels, and provides statistical insights in a customisable table. This indicator is ideal for traders who want to study price behaviour relative to historical levels and identify patterns based on the current session's open price.
Features:
Multi-Timeframe Levels: Displays OHLC and deviation levels (0.2, 0.5, 0.8 of the prior candle's range) from a selected timeframe (default: 1h).
Hit Statistics: Counts the number of times price crosses each level, split into two categories:
Current session open > Previous session open
Current session open < Previous session open
Movement Tracking: Monitors specific price movements:
Price crossing below the prior low and returning to the 0.5 deviation level
Price crossing above the prior high and returning to the 0.5 deviation level
Price crossing the prior high and then hitting the current session's open
Customizable Display:
Toggle labels for previous levels (Open, High, Low, Close, Dev 0.2, 0.5, 0.8)
Options to show only the last set of levels or extend lines across the chart
Adjustable line styles, colours, and thickness for each level
Stats Table: A configurable table displays hit percentages and total session counts, with options for position, size, colours, and borders.
How to Use:
Setup:
Add the indicator to your chart via the Trading View Indicators menu.
Adjust the Time Frame (under "General Settings") to your preferred period (e.g., "D" for daily, "60" for 1-hour).
Set the Offset to determine which prior candle to analyse (default: 1, meaning the previous candle).
Display Customization:
In "Display Settings":
Enable/disable Show last OHLC levels only to limit plotting to the most recent levels.
Enable Extend OHLC levels to draw lines across the chart.
Toggle Show previous level labels to show/hide labels (default: on).
Customize line styles, colours, and widths under the respective level groups (e.g., "Previous Open Level").
Table Configuration:
In the "Table" settings:
Toggle Show Stats Table to display/hide the table (default: on).
Choose Table Position (e.g., Top Right) and Text Size (e.g., Tiny).
Adjust colours for text, background, frame, and borders, plus frame/border widths.
Interpretation:
Lines: Represent the previous candle’s OHLC and deviation levels, color-coded for easy identification.
Table: Shows the percentage of sessions where price crossed each level, split by whether the current open is above or below the previous open. It also tracks total sessions and specific movement patterns.
Use the data to observe how often price interacts with these levels under different conditions, aiding in pattern recognition and strategy development.
Notes:
The indicator uses the first bar’s open price of the current session to compare with the previous session’s open, ensuring accurate categorization.
Percentages are calculated based on total sessions in each category (Above/Below), with "N/A" displayed if no sessions exist to avoid division by zero.
This tool is for informational purposes only and does not provide trading signals or guarantees of future performance.
Test different timeframes to suit your trading style (e.g., shorter for intraday, longer for swing trading).
Adjust table settings to optimize visibility on your chart layout.
Feedback:
I’d love to hear your thoughts! Feel free to leave a comment or rating to help improve this indicator for the Trading View community.
Open-source script
In true TradingView spirit, the creator of this script has made it open-source, so that traders can review and verify its functionality. Kudos to the author! While you can use it for free, remember that republishing the code is subject to our House Rules.
Disclaimer
The information and publications are not meant to be, and do not constitute, financial, investment, trading, or other types of advice or recommendations supplied or endorsed by TradingView. Read more in the Terms of Use.