OPEN-SOURCE SCRIPT
PSDI
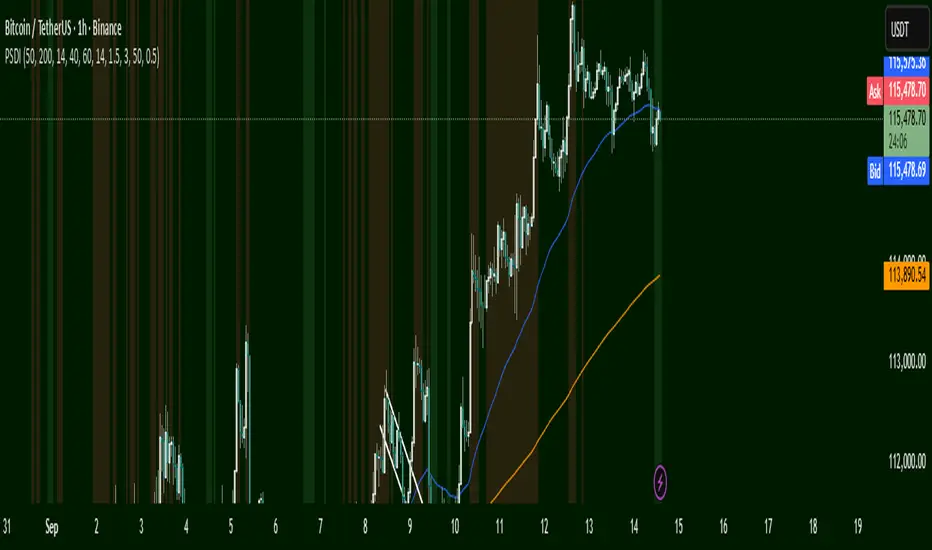
Green Zone → Potential Buy Area
Price is near support.
Red Zone → Potential Sell Area
Price is near resistance.
EMA Lines
Blue (EMA50) above Orange (EMA200): Trend up → favors buys.
Blue below Orange: Trend down → favors sells.
How to Use
Look at zones and trend.
Price near green + trend up → consider long.
Price near red + trend down → consider short.
NOTE: When in uptrend, only follow green zones. When in down trend only follow red zones.
Open-source script
In true TradingView spirit, the creator of this script has made it open-source, so that traders can review and verify its functionality. Kudos to the author! While you can use it for free, remember that republishing the code is subject to our House Rules.
Disclaimer
The information and publications are not meant to be, and do not constitute, financial, investment, trading, or other types of advice or recommendations supplied or endorsed by TradingView. Read more in the Terms of Use.