OPEN-SOURCE SCRIPT
Long/Short with Quality Filter
//version=6
indicator("Long/Short with Quality Filter", overlay=true)
// --- Inputs ---
lenFast = input.int(20, "Fast EMA")
lenSlow = input.int(50, "Slow EMA")
src = close
emaFast = ta.ema(src, lenFast)
emaSlow = ta.ema(src, lenSlow)
rsiLen = input.int(14, "RSI Length")
rsi = ta.rsi(src, rsiLen)
// ---------- FILTER PIECES ----------
// 1. EMAs stacked & angled bullish
emaBullTrend = emaFast > emaSlow and emaFast > emaFast[1] and emaSlow > emaSlow[1]
// 2. Structure break: close > recent high (micro-resistance)
lookbackHH = input.int(10, "Structure lookback (bars)")
brokeStructure = close > ta.highest(high[1], lookbackHH)
// 3. RSI in “trend mode”
rsiBull = rsi > 55 and rsi > rsi[1]
// 4. Full-body breakout candle above EMAs
body = math.abs(close - open)
barRange = high - low
strongBody = barRange > 0 and body > 0.5 * barRange
aboveEMAs = close > emaFast and close > emaSlow
breakoutCandle = strongBody and aboveEMAs
// ✅ Combined long-quality filter
longFilter = emaBullTrend and brokeStructure and rsiBull and breakoutCandle
// --- Your original signals (replace these with your real conditions) ---
rawLong = ta.crossover(emaFast, emaSlow) // example only
rawShort = ta.crossunder(emaFast, emaSlow) // example only
// Apply quality filter
longSignal = rawLong and longFilter
// ----- Optional: mirrored quality filter for shorts -----
emaBearTrend = emaFast < emaSlow and emaFast < emaFast[1] and emaSlow < emaSlow[1]
brokeStructureD = close < ta.lowest(low[1], lookbackHH)
rsiBear = rsi < 45 and rsi < rsi[1]
belowEMAs = close < emaFast and close < emaSlow
strongBodyDown = barRange > 0 and body > 0.5 * barRange and close < open
breakdownCandle = strongBodyDown and belowEMAs
shortFilter = emaBearTrend and brokeStructureD and rsiBear and breakdownCandle
shortSignal = rawShort and shortFilter
// --- Plot signals ---
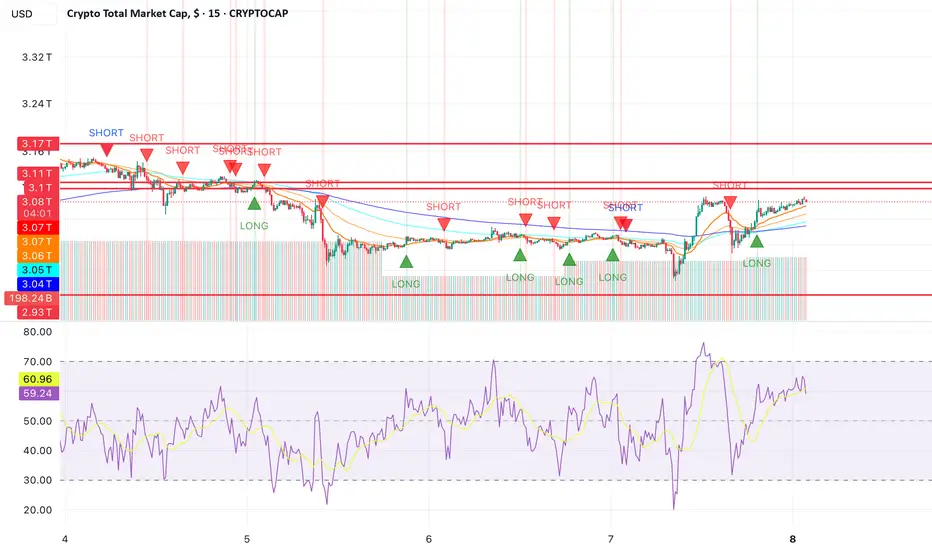
plotshape(longSignal, title="LONG", style=shape.triangleup, location=location.belowbar, color=color.new(color.lime, 0), size=size.small, text="LONG")
plotshape(shortSignal, title="SHORT", style=shape.triangledown, location=location.abovebar, color=color.new(color.red, 0), size=size.small, text="SHORT")
indicator("Long/Short with Quality Filter", overlay=true)
// --- Inputs ---
lenFast = input.int(20, "Fast EMA")
lenSlow = input.int(50, "Slow EMA")
src = close
emaFast = ta.ema(src, lenFast)
emaSlow = ta.ema(src, lenSlow)
rsiLen = input.int(14, "RSI Length")
rsi = ta.rsi(src, rsiLen)
// ---------- FILTER PIECES ----------
// 1. EMAs stacked & angled bullish
emaBullTrend = emaFast > emaSlow and emaFast > emaFast[1] and emaSlow > emaSlow[1]
// 2. Structure break: close > recent high (micro-resistance)
lookbackHH = input.int(10, "Structure lookback (bars)")
brokeStructure = close > ta.highest(high[1], lookbackHH)
// 3. RSI in “trend mode”
rsiBull = rsi > 55 and rsi > rsi[1]
// 4. Full-body breakout candle above EMAs
body = math.abs(close - open)
barRange = high - low
strongBody = barRange > 0 and body > 0.5 * barRange
aboveEMAs = close > emaFast and close > emaSlow
breakoutCandle = strongBody and aboveEMAs
// ✅ Combined long-quality filter
longFilter = emaBullTrend and brokeStructure and rsiBull and breakoutCandle
// --- Your original signals (replace these with your real conditions) ---
rawLong = ta.crossover(emaFast, emaSlow) // example only
rawShort = ta.crossunder(emaFast, emaSlow) // example only
// Apply quality filter
longSignal = rawLong and longFilter
// ----- Optional: mirrored quality filter for shorts -----
emaBearTrend = emaFast < emaSlow and emaFast < emaFast[1] and emaSlow < emaSlow[1]
brokeStructureD = close < ta.lowest(low[1], lookbackHH)
rsiBear = rsi < 45 and rsi < rsi[1]
belowEMAs = close < emaFast and close < emaSlow
strongBodyDown = barRange > 0 and body > 0.5 * barRange and close < open
breakdownCandle = strongBodyDown and belowEMAs
shortFilter = emaBearTrend and brokeStructureD and rsiBear and breakdownCandle
shortSignal = rawShort and shortFilter
// --- Plot signals ---
plotshape(longSignal, title="LONG", style=shape.triangleup, location=location.belowbar, color=color.new(color.lime, 0), size=size.small, text="LONG")
plotshape(shortSignal, title="SHORT", style=shape.triangledown, location=location.abovebar, color=color.new(color.red, 0), size=size.small, text="SHORT")
Open-source script
In true TradingView spirit, the creator of this script has made it open-source, so that traders can review and verify its functionality. Kudos to the author! While you can use it for free, remember that republishing the code is subject to our House Rules.
Disclaimer
The information and publications are not meant to be, and do not constitute, financial, investment, trading, or other types of advice or recommendations supplied or endorsed by TradingView. Read more in the Terms of Use.