Trend Analysis [Ultimate] (Expo)
We have developed a Trend Analysis Indicator with many great functionalities that help traders to:
- Identify when a confirmed trend starts and ends.
- Identify pullbacks within trends.
- Identify the current trend direction and potential trend shifts.
The indicator differentiates between different trend characteristics to measure the current trend stage. Everything is identified in real-time and without repainting.
█ How is the trend characteristic calculated?
This Trend Analysis Indicator uses different calculations method, such as Fibonacci ratios, price retracements, cycles, and volatility measures, to calculate the trend characteristic. These values are used in an EWMA* function (similar to RMA). This function is used to smooth out the noise in data sets and to better identify cyclic patterns in the data. This function works by giving greater weight to more recent data points and less weight to older data points. This allows it to better identify and track trends in the data. The indicator is a valuable and useful tool for market analysis and can be used to evaluate the strength, direction, and characteristics of trends in a market.
█ Trend Trading
Identifying the trend in trading is important because it helps traders to understand the direction in which the market is moving. Knowing the trend allows traders to develop more accurate trading strategies. Entering into a confirmed trend reduces your risk and increases the profit potential. However, knowing when to exit a trending market can be even harder. That is why we have developed this indicator that will notify you when the trend move is about to end.
The key to success in trend trading lies in being able to recognize the beginning and end of a trend, as well as being able to spot pullbacks within an established trend. This trend indicator is a valuable tool to get insights into the current trend characteristic, which helps traders to spot new trends and pullbacks.
█ How to use
Trend
This indicator should be used with trend analysis! Combine the indicators' insights with trend lines , channels, market structure, etc., to better understand the current trend structure.
- This indicator is about confirming a trend and understanding when a trend might start and end.
- Use this indicator to confirm and gain insights about trend structure.
Trend Change
The indicator comes with a background and bar coloring that detects the current trend and displays when the trend has a higher likelihood of changing.
Pullback
Pullback traders will find this indicator very useful to confirm and find pullbacks within trends.
█ Indicator Features
This Trend Analysis indicator has many valuable features for trend trading:
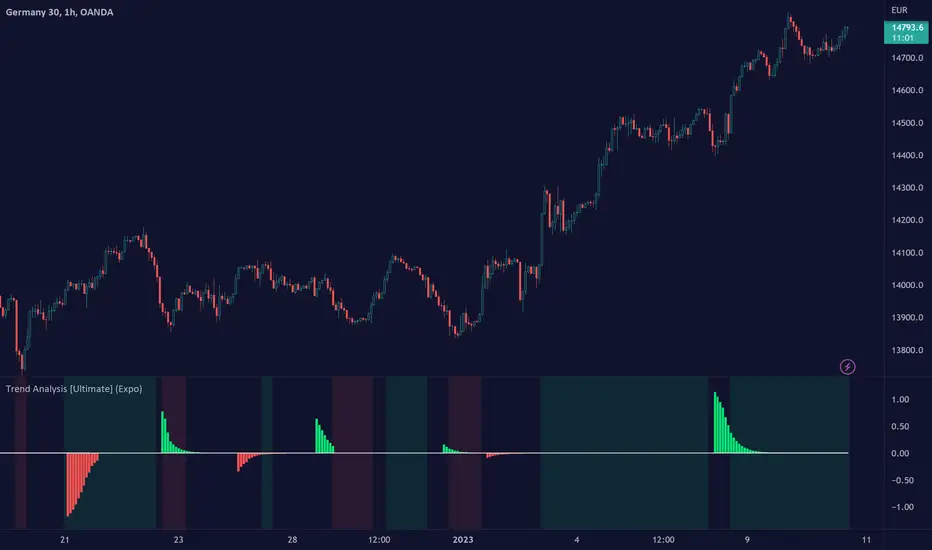
Start & End of the Trend Feature:
First, the default settings display a green and red histogram, which we call; (Start/End of Trend). This feature identifies when a confirmed trend is about to start/end and finds pullbacks within the trend.
Confirmed Trend:
Enable the confirmed trend if you want to display a green and red histogram when the trend is confirmed. When this histogram peaks, traders know that a momentum move in the trend direction is completed. This is a sign that the trend is strong. However, after such a move, a retracement is likely to happen. Use these peaks to take partial profits and to prepare to enter into the trend on the pullback that is likely to come.
Bar Coloring:
Bar coloring shows the direction of the trend and identifies areas where the trend has a higher probability of changing direction. When the bar coloring becomes white, traders know that the current price action within the trend has a characteristic of that there is a higher likelihood of a trend change. Use this insight to prepare for a potential trend change.
Background Coloring:
The background coloring is displayed when a strong trend is detected.
*EWMA stands for Exponentially Weighted Moving Average. It is a type of time series forecasting method that assigns greater weight to recent observations in a time series data set. It is a way of smoothing out the data to remove the noise and make it easier to identify patterns and trends.
-----------------
Disclaimer
The information contained in my Scripts/Indicators/Ideas/Algos/Systems does not constitute financial advice or a solicitation to buy or sell any securities of any type. I will not accept liability for any loss or damage, including without limitation any loss of profit, which may arise directly or indirectly from the use of or reliance on such information.
All investments involve risk, and the past performance of a security, industry, sector, market, financial product, trading strategy, backtest, or individual's trading does not guarantee future results or returns. Investors are fully responsible for any investment decisions they make. Such decisions should be based solely on an evaluation of their financial circumstances, investment objectives, risk tolerance, and liquidity needs.
My Scripts/Indicators/Ideas/Algos/Systems are only for educational purposes!
Invite-only script
Only users approved by the author can access this script. You'll need to request and get permission to use it. This is typically granted after payment. For more details, follow the author's instructions below or contact Zeiierman directly.
TradingView does NOT recommend paying for or using a script unless you fully trust its author and understand how it works. You may also find free, open-source alternatives in our community scripts.
Author's instructions
Join Our Free Discord: discord.gg/zeiiermantrading
Disclaimer
Invite-only script
Only users approved by the author can access this script. You'll need to request and get permission to use it. This is typically granted after payment. For more details, follow the author's instructions below or contact Zeiierman directly.
TradingView does NOT recommend paying for or using a script unless you fully trust its author and understand how it works. You may also find free, open-source alternatives in our community scripts.
Author's instructions
Join Our Free Discord: discord.gg/zeiiermantrading