OPEN-SOURCE SCRIPT
Dskyz (DAFE) Aurora Divergence
- Dskyz (DAFE) Aurora Divergence Indicator
Advanced Divergence Detection for Traders. Unleash the power of divergence trading with this cutting-edge indicator that combines price and volume analysis to spot high-probability reversal signals.
🧠 What Is It?
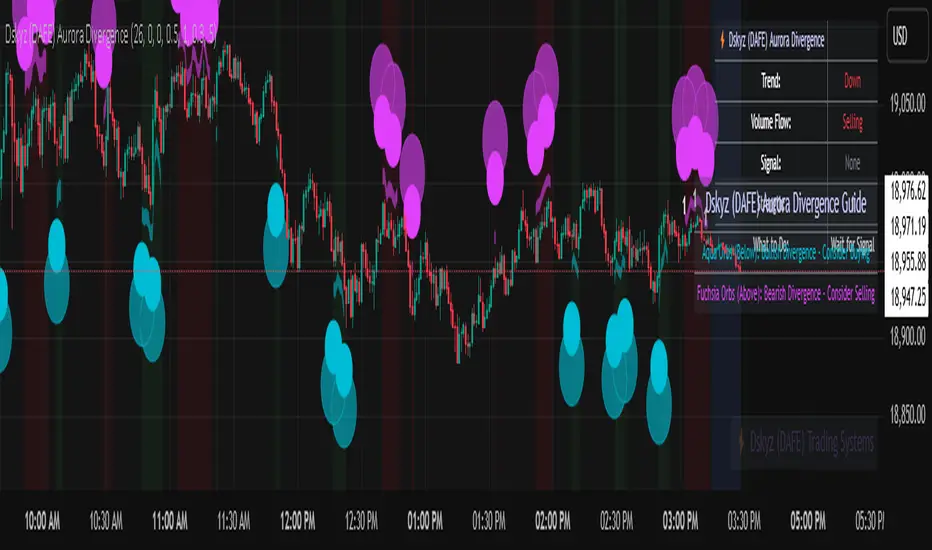
The Dskyz (DAFE) Aurora Divergence Indicator is designed to identify bullish and bearish divergences between the price trend and the On Balance Volume (OBV) trend. Divergence occurs when the price of an asset and a technical indicator (in this case, OBV) move in opposite directions, signaling a potential reversal. This indicator uses linear regression slopes to calculate the trends of both price and OBV over a specified lookback period, detecting when these two metrics are diverging. When a divergence is detected, it highlights potential reversal points with visually striking aurora bands, orbs, and labels, making it easy for traders to spot key signals.
⚙️ Inputs & How to Use Them
The indicator is highly customizable, with inputs grouped under "⚡ DAFE Aurora Settings" for clarity. Here’s how each input works:
Lookback Period: Determines how many bars are used to calculate the price and OBV slopes. Higher values detect longer-term trends (e.g., 20 for 1H charts), while lower values are more responsive to short-term movements.
Price Slope Threshold: Sets the minimum slope value for the price to be considered in an uptrend or downtrend. A value of 0 allows all slopes to be considered, while higher values filter for stronger trends.
OBV Slope Threshold: Similar to the price slope threshold but for OBV. Helps filter out weak volume trends.
Aurora Band Width: Adjusts the width of the visual bands that highlight divergence areas. Wider bands make the indicator more visible but may clutter the chart.
Divergence Sensitivity: Scales the strength of the divergence signals. Higher values make the indicator more sensitive to smaller divergences.
Minimum Strength: Filters out weak signals by only showing divergences above this strength level. A default of 0.3 is recommended for beginners.
Signal Cooldown (Bars): Prevents multiple signals from appearing too close together. Default is 5 bars, reducing chart clutter and helping traders focus on significant signals.
These inputs allow traders to fine-tune the indicator to match their trading style and timeframe.
🚀 What Makes It Unique?
This indicator stands out with its innovative features:
Price-Volume Divergence: Combines price trend (slope) and OBV trend for more reliable signals than price-only divergences.
Aurora Bands: Dynamic visual bands that highlight divergence zones, making it easier to spot potential reversals at a glance.
Interactive Dashboard: Displays real-time information on trend direction, volume flow, signal type, strength, and recommended actions (e.g., "Consider Buying" or "Consider Selling").
Signal Cooldown: Ensures only the most significant divergences are shown, reducing noise and improving usability.
Alerts: Built-in alerts for both bullish and bearish divergences, allowing traders to stay informed even when not actively monitoring the chart.
Beginner Guide: Explains the indicator’s visuals (e.g., aqua orbs for bullish signals, fuchsia orbs for bearish signals), making it accessible for new users.
🎯 Why It Works
The indicator’s effectiveness lies in its use of price-volume divergence, a well-established concept in technical analysis. When the price trend and OBV trend diverge, it often signals a potential reversal because the underlying volume support (or lack thereof) is not aligning with the price action. For example:
Bullish Divergence: Occurs when the price is making lower lows, but the OBV is making higher lows, indicating weakening selling pressure and potential upward reversal.
Bearish Divergence: Occurs when the price is making higher highs, but the OBV is making lower highs, suggesting weakening buying pressure and potential downward reversal.
The use of linear regression ensures smooth and accurate trend calculations over the specified lookback period. The divergence strength is then normalized and filtered based on user-defined thresholds, ensuring only high-quality signals are displayed. Additionally, the cooldown period prevents signal overload, allowing traders to focus on the most significant opportunities.
🧬 Indicator Recommendation
Best For: Traders looking to identify potential trend reversals in any market, especially those where volume data is reliable (e.g., stocks, futures, forex).
Timeframes: Suitable for all timeframes. Adjust the lookback period accordingly—smaller values for shorter timeframes (e.g., 1H), larger for longer ones (e.g., 4H or daily).
Pair With: Support and resistance levels, trend lines, other oscillators (e.g., RSI, MACD) for confirmation, and volume profile tools for deeper analysis.
Tips:
Look for divergences at key support/resistance levels for higher-probability setups.
Pay attention to signal strength; higher strength divergences are often more reliable.
Use the dashboard to quickly assess market conditions before entering a trade.
Set up alerts to catch divergences even when not actively watching the chart.
🧾 Credit & Acknowledgement
This indicator builds upon the classic concept of price-volume divergence, enhancing it with modern visualization techniques, advanced filtering, and user-friendly features. It is designed to provide traders with a powerful yet intuitive tool for spotting reversals.
📌 Final Thoughts
The Dskyz (DAFE) Aurora Divergence Indicator is more than just a divergence tool; it’s a comprehensive trading assistant that combines advanced calculations, intuitive visualizations, and actionable insights. Whether you’re a seasoned trader or just starting out, this indicator can help you spot high-probability reversal points with confidence.
Use it with discipline. Use it with clarity. Trade smarter.
**I will continue to release incredible strategies and indicators until I turn this into a brand or until someone offers me a contract.
-Dskyz
Advanced Divergence Detection for Traders. Unleash the power of divergence trading with this cutting-edge indicator that combines price and volume analysis to spot high-probability reversal signals.
🧠 What Is It?
The Dskyz (DAFE) Aurora Divergence Indicator is designed to identify bullish and bearish divergences between the price trend and the On Balance Volume (OBV) trend. Divergence occurs when the price of an asset and a technical indicator (in this case, OBV) move in opposite directions, signaling a potential reversal. This indicator uses linear regression slopes to calculate the trends of both price and OBV over a specified lookback period, detecting when these two metrics are diverging. When a divergence is detected, it highlights potential reversal points with visually striking aurora bands, orbs, and labels, making it easy for traders to spot key signals.
⚙️ Inputs & How to Use Them
The indicator is highly customizable, with inputs grouped under "⚡ DAFE Aurora Settings" for clarity. Here’s how each input works:
Lookback Period: Determines how many bars are used to calculate the price and OBV slopes. Higher values detect longer-term trends (e.g., 20 for 1H charts), while lower values are more responsive to short-term movements.
Price Slope Threshold: Sets the minimum slope value for the price to be considered in an uptrend or downtrend. A value of 0 allows all slopes to be considered, while higher values filter for stronger trends.
OBV Slope Threshold: Similar to the price slope threshold but for OBV. Helps filter out weak volume trends.
Aurora Band Width: Adjusts the width of the visual bands that highlight divergence areas. Wider bands make the indicator more visible but may clutter the chart.
Divergence Sensitivity: Scales the strength of the divergence signals. Higher values make the indicator more sensitive to smaller divergences.
Minimum Strength: Filters out weak signals by only showing divergences above this strength level. A default of 0.3 is recommended for beginners.
Signal Cooldown (Bars): Prevents multiple signals from appearing too close together. Default is 5 bars, reducing chart clutter and helping traders focus on significant signals.
These inputs allow traders to fine-tune the indicator to match their trading style and timeframe.
🚀 What Makes It Unique?
This indicator stands out with its innovative features:
Price-Volume Divergence: Combines price trend (slope) and OBV trend for more reliable signals than price-only divergences.
Aurora Bands: Dynamic visual bands that highlight divergence zones, making it easier to spot potential reversals at a glance.
Interactive Dashboard: Displays real-time information on trend direction, volume flow, signal type, strength, and recommended actions (e.g., "Consider Buying" or "Consider Selling").
Signal Cooldown: Ensures only the most significant divergences are shown, reducing noise and improving usability.
Alerts: Built-in alerts for both bullish and bearish divergences, allowing traders to stay informed even when not actively monitoring the chart.
Beginner Guide: Explains the indicator’s visuals (e.g., aqua orbs for bullish signals, fuchsia orbs for bearish signals), making it accessible for new users.
🎯 Why It Works
The indicator’s effectiveness lies in its use of price-volume divergence, a well-established concept in technical analysis. When the price trend and OBV trend diverge, it often signals a potential reversal because the underlying volume support (or lack thereof) is not aligning with the price action. For example:
Bullish Divergence: Occurs when the price is making lower lows, but the OBV is making higher lows, indicating weakening selling pressure and potential upward reversal.
Bearish Divergence: Occurs when the price is making higher highs, but the OBV is making lower highs, suggesting weakening buying pressure and potential downward reversal.
The use of linear regression ensures smooth and accurate trend calculations over the specified lookback period. The divergence strength is then normalized and filtered based on user-defined thresholds, ensuring only high-quality signals are displayed. Additionally, the cooldown period prevents signal overload, allowing traders to focus on the most significant opportunities.
🧬 Indicator Recommendation
Best For: Traders looking to identify potential trend reversals in any market, especially those where volume data is reliable (e.g., stocks, futures, forex).
Timeframes: Suitable for all timeframes. Adjust the lookback period accordingly—smaller values for shorter timeframes (e.g., 1H), larger for longer ones (e.g., 4H or daily).
Pair With: Support and resistance levels, trend lines, other oscillators (e.g., RSI, MACD) for confirmation, and volume profile tools for deeper analysis.
Tips:
Look for divergences at key support/resistance levels for higher-probability setups.
Pay attention to signal strength; higher strength divergences are often more reliable.
Use the dashboard to quickly assess market conditions before entering a trade.
Set up alerts to catch divergences even when not actively watching the chart.
🧾 Credit & Acknowledgement
This indicator builds upon the classic concept of price-volume divergence, enhancing it with modern visualization techniques, advanced filtering, and user-friendly features. It is designed to provide traders with a powerful yet intuitive tool for spotting reversals.
📌 Final Thoughts
The Dskyz (DAFE) Aurora Divergence Indicator is more than just a divergence tool; it’s a comprehensive trading assistant that combines advanced calculations, intuitive visualizations, and actionable insights. Whether you’re a seasoned trader or just starting out, this indicator can help you spot high-probability reversal points with confidence.
Use it with discipline. Use it with clarity. Trade smarter.
**I will continue to release incredible strategies and indicators until I turn this into a brand or until someone offers me a contract.
-Dskyz
Open-source script
In true TradingView spirit, the creator of this script has made it open-source, so that traders can review and verify its functionality. Kudos to the author! While you can use it for free, remember that republishing the code is subject to our House Rules.
Empowering everyday traders and DAFE Trading Systems
DAFETradingSystems.com
DAFETradingSystems.com
Disclaimer
The information and publications are not meant to be, and do not constitute, financial, investment, trading, or other types of advice or recommendations supplied or endorsed by TradingView. Read more in the Terms of Use.