OPEN-SOURCE SCRIPT
Squeeze PRO Indicator [Makit0]
SQUEEZE PRO INDICATOR [Makit0] v0.5Beta
Script based in:
original John Carter's ideas (SQUEEZE & SQUEEZE PRO) at simplertrading dot com
LazyBear's script (Squeeze Momentum Indicator) here at tradingview dot com
USE IT IN CONJUNCTION WITH THE SQUEEZE PRO ARROWS INDICATOR
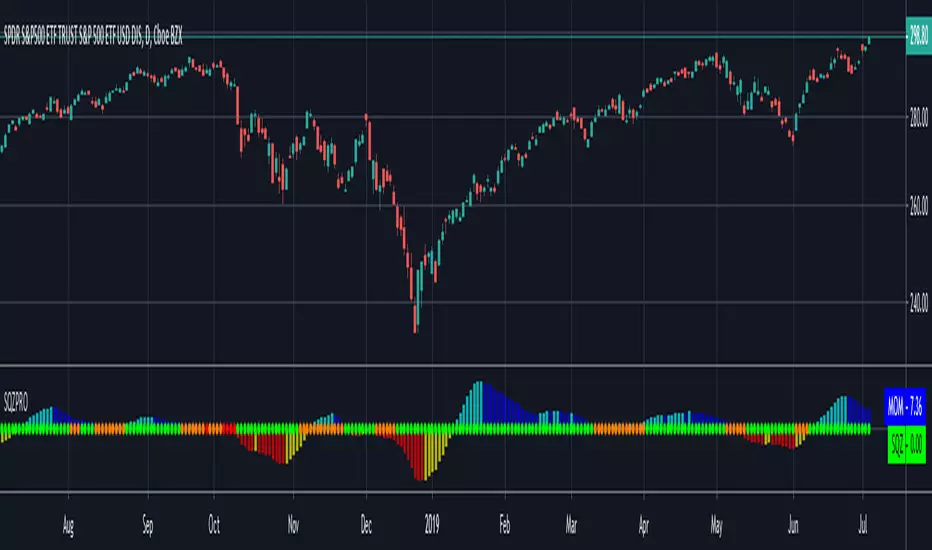
This system is based in the volatility reversion to the mean: volatility contraction leads to volatility expansion and the other way on
The dot signal is a warning of volatility compression, more often than not this leads to a expansion of volatility and a move in the action price usually bigger than the expected move
Be aware of the trend direction, use the momentum histogram to see the slope direction
There are 3 levels of compression:
Level 1: ORANGE, the lesser compresion level
Level 2: RED, the normal level marked by the original squeeze indicator
Level 3: YELLOW, the max compression level
The more the compression the bigger the after move
The GREEN dots signal the volatility expansion out of the squeeze ranges
Please check the John Carter's book (Mastering the Trade) and attend his webinars for more insight about the squeeze & squeeze pro systems
I'm starting at trading and learning every day, I attended one of his webinars about the Squeeze Pro, and with help of the LazyBear's Squeeze Momentum Indicator code up the Squeeze PRO.
Please be aware, I'm not an expert trader, only a developer with an idea: learn to pull out money from the market in a consistent way.
This is a Beta version, please feel free to comment and give feedback, anything you consider iteresting, the more you elaborate the better :D
Thanks you all!!!
Script based in:
original John Carter's ideas (SQUEEZE & SQUEEZE PRO) at simplertrading dot com
LazyBear's script (Squeeze Momentum Indicator) here at tradingview dot com
USE IT IN CONJUNCTION WITH THE SQUEEZE PRO ARROWS INDICATOR
This system is based in the volatility reversion to the mean: volatility contraction leads to volatility expansion and the other way on
The dot signal is a warning of volatility compression, more often than not this leads to a expansion of volatility and a move in the action price usually bigger than the expected move
Be aware of the trend direction, use the momentum histogram to see the slope direction
There are 3 levels of compression:
Level 1: ORANGE, the lesser compresion level
Level 2: RED, the normal level marked by the original squeeze indicator
Level 3: YELLOW, the max compression level
The more the compression the bigger the after move
The GREEN dots signal the volatility expansion out of the squeeze ranges
Please check the John Carter's book (Mastering the Trade) and attend his webinars for more insight about the squeeze & squeeze pro systems
I'm starting at trading and learning every day, I attended one of his webinars about the Squeeze Pro, and with help of the LazyBear's Squeeze Momentum Indicator code up the Squeeze PRO.
Please be aware, I'm not an expert trader, only a developer with an idea: learn to pull out money from the market in a consistent way.
This is a Beta version, please feel free to comment and give feedback, anything you consider iteresting, the more you elaborate the better :D
Thanks you all!!!
Open-source script
In true TradingView spirit, the creator of this script has made it open-source, so that traders can review and verify its functionality. Kudos to the author! While you can use it for free, remember that republishing the code is subject to our House Rules.
Disclaimer
The information and publications are not meant to be, and do not constitute, financial, investment, trading, or other types of advice or recommendations supplied or endorsed by TradingView. Read more in the Terms of Use.