PROTECTED SOURCE SCRIPT
CPR D/W/M – ThorenFX | Trinity Traders
🧭 CPR D/W/M – ThorenFX | Trinity Traders
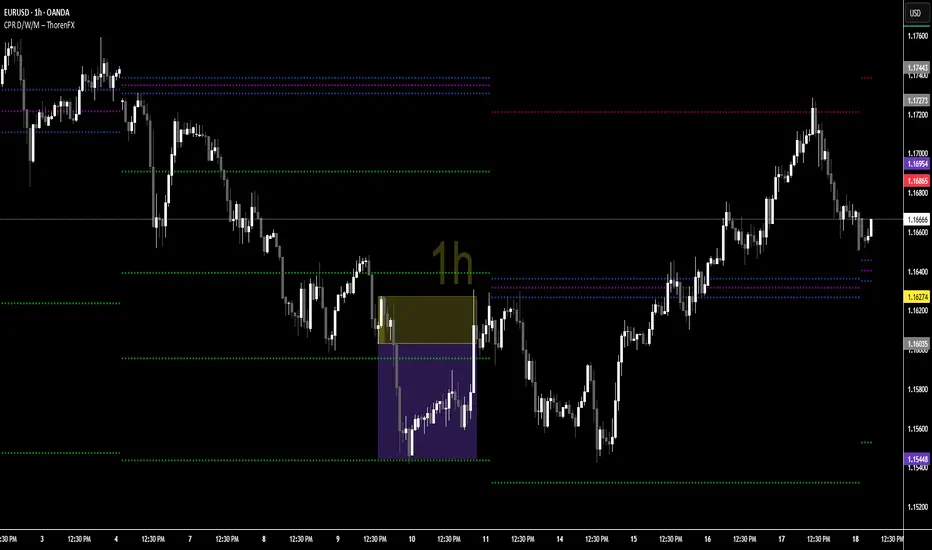
The CPR D/W/M – ThorenFX | Trinity Traders indicator plots Central Pivot Range (CPR) and Floor Pivot levels for Daily, Weekly, and Monthly timeframes — all in one script.
It helps traders identify market structure, bias, and potential reversal zones through multi-timeframe confluence of pivot levels.
⚙️ Core Logic
The indicator calculates each timeframe’s CPR and Support/Resistance levels using standard floor pivot formulas based on the previous period’s OHLC (Open, High, Low, Close):
Central Pivot Range (CPR):
Pivot (P) = (High + Low + Close) / 3
Top Central (TC) and Bottom Central (BC) define the CPR band
The distance between TC and BC indicates market volatility
Support & Resistance Levels:
R1–R4: Resistance zones above CPR
S1–S4: Support zones below CPR
All levels are dynamically plotted and color-coded for instant readability.
🧩 Included Timeframes
📅 Daily CPR → Ideal for intraday and short-term bias
🗓 Weekly CPR → Defines swing zones and trend continuation structure
📆 Monthly CPR → Long-term bias and institutional-level reaction zones
Each timeframe’s levels and labels can be toggled independently.
🎨 Visual Design
Element Color Description
Pivot (CPR) 🟣 Purple Central pivot point
TC / BC 🔵 Blue Top & Bottom CPR boundaries
Resistances (R1–R4) 🔴 Red Key resistance zones
Supports (S1–S4) 🟢 Green Key support zones
Labels are displayed on the right side of the chart for each level (e.g., D-R1, W-TC, M-CPR), allowing quick recognition without clutter.
📘 Usage Guide
Narrow CPR → Market likely to trend
Wide CPR → Market likely to range
Confluence of levels (e.g., Daily R1 ≈ Weekly CPR) often indicates high-probability reversal or breakout zones
Works across all markets — Forex, Indices, Commodities, and Equities
⚖️ Indicator Notes
Uses pure price-derived calculations (no lagging indicators).
Optimized for clarity, minimal overlap, and multi-timeframe confluence.
Each timeframe’s display and labels can be customized or hidden in settings.
Suitable for all timeframes and market types.
Protected script
This script is published as closed-source. However, you can use it freely and without any limitations – learn more here.
Disclaimer
The information and publications are not meant to be, and do not constitute, financial, investment, trading, or other types of advice or recommendations supplied or endorsed by TradingView. Read more in the Terms of Use.