OPEN-SOURCE SCRIPT
Anomaly Detector
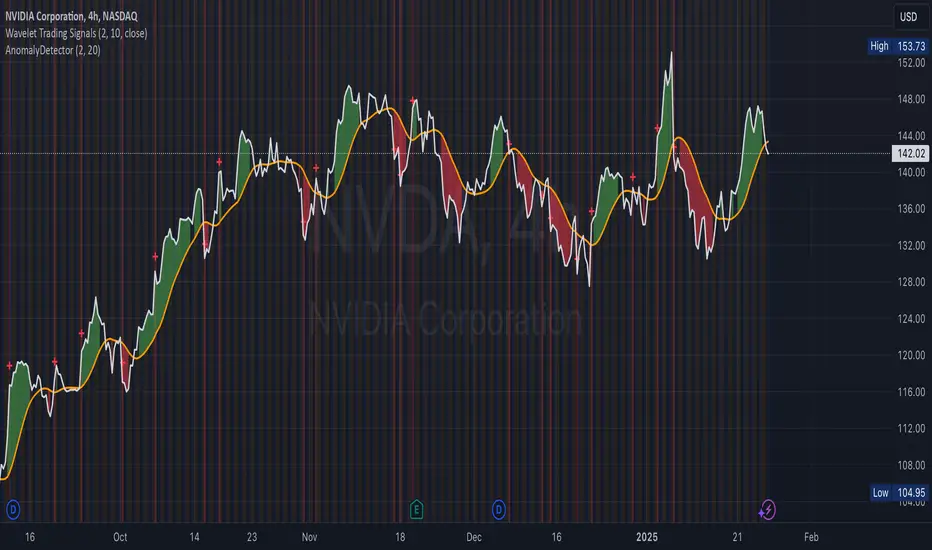
Price Anomaly Detector
This is a script designed to identify unusual price movements. By analyzing deviations from typical price behavior, this tool helps traders spot potential trading opportunities and manage risks effectively.
---
Features
- Anomaly Detection: Flags price points that significantly deviate from the average.
- Visual Indicators: Highlights anomalies with background colors and cross markers.
- Customizable Settings: Adjust sensitivity and window size to match your trading strategy.
- Real-Time Analysis: Continuously updates anomaly signals as new data is received.
---
Usage
After adding the indicator to your chart:
1. View Anomalies: Red backgrounds and cross markers indicate detected anomalies.
2. Adjust Settings: Modify the `StdDev Threshold` and `Window Length` to change detection sensitivity.
3. Interpret Signals:
- Red Background: Anomaly detected on that bar.
- Red Cross: Specific point of anomaly.
---
Inputs
- StdDev Threshold: Higher values reduce anomaly sensitivity. Default: 2.0.
- Window Length: Larger windows smooth data, reducing false positives. Default: 20.
---
Limitations
- Approximation Method: Uses a simple method to detect anomalies, which may not capture all types of unusual price movements.
- Performance: Extremely large window sizes may impact script performance.
- Segment Detection: Does not group consecutive anomalies into segments.
---
Disclaimer: This tool is for educational purposes only. Trading involves risk, and you should perform your own analysis before making decisions. The author is not liable for any losses incurred.
Open-source script
In true TradingView spirit, the creator of this script has made it open-source, so that traders can review and verify its functionality. Kudos to the author! While you can use it for free, remember that republishing the code is subject to our House Rules.
Disclaimer
The information and publications are not meant to be, and do not constitute, financial, investment, trading, or other types of advice or recommendations supplied or endorsed by TradingView. Read more in the Terms of Use.