PROTECTED SOURCE SCRIPT
Updated Paul_BDT Osc. RSI with Divergence, Order Blocks & Channel
//=====================================================================
// Combination of:
// 1. Classic RSI with overbought/oversold thresholds
// 2. Adaptive bands on RSI (dynamically calculated with EMA of gains/losses)
// 3. Moving averages on RSI (optional, including SMA + Bollinger Bands)
// 4. Detection of RSI/price divergences (classic: bullish and bearish)
// 5. Detection of ranges (consolidation zones) with Order Blocks and extensions
// 6. Candle coloring based on dynamic RSI thresholds (breakout/breakdown)
//
// All with multi-timeframe options (displaying adaptive bands from a higher timeframe).
//=====================================================================
//=======================//
// 1. INPUTS (Parameters)
//=======================//
// RSI parameters: source, length, OB/OS thresholds, higher timeframe, divergence activation, adaptive bands display
// Smoothing parameters: choice of MA type applied to RSI (SMA, EMA, etc.) + optional Bollinger Bands
// Order Block parameters: display of ranges, order blocks, zone and candle colors
//=======================//
// 2. CALCULATIONS
//=======================//
// Base RSI calculated on the selected source (default: close)
// Smoothing: applies a chosen moving average to the RSI
// If 'SMA + Bollinger Bands' is selected, also calculates standard deviation to plot the bands
// Adaptive RSI bands: calculated via EMA method of gains/losses over a specific period (close to Wilder's RSI)
// Two adaptive thresholds are defined: upper (overbought) and lower (oversold), which adjust according to the market
// Multi-timeframes:
// Retrieves adaptive bands calculated on a higher timeframe (e.g., daily if TF = 'D')
// Allows overlaying adaptive RSI thresholds from different timeframes
// Dynamic definition of RSI thresholds for candle coloring:
// - Bullish/bearish center: 55/45
// - Adjusts the thresholds based on the price position relative to SMA 200 (if > SMA200, bullish center is used)
//=======================//
// 3. PLOTS (Displays)
//=======================//
// Display of the classic RSI with its OB/OS thresholds + gradient fill to better visualize the zones
// Display of moving averages on RSI and optional Bollinger Bands (if enabled)
// Display of adaptive RSI bands:
// - Those from the higher timeframe (always displayed)
// - Those from the current timeframe (optional display)
// Candle coloring (barcolor):
// - Green if RSI exceeds the dynamic upper threshold (breakout)
// - Red if RSI drops below the dynamic lower threshold (breakdown)
// - Specific color for candles within the neutral zone (range candle color)
//=======================//
// 4. DIVERGENCES
//=======================//
// Detection of regular RSI/price divergences:
// - Bullish divergence: price forms a new lower low, RSI forms a higher low
// - Bearish divergence: price forms a new higher high, RSI forms a lower high
// Display on the RSI panel:
// - Curves and labels (Bull/Bear) at divergence points
//=======================//
// 5. RANGE DETECTION & ORDER BLOCKS
//=======================//
// Automatic detection of ranges (consolidation zones):
// - Based on dynamic RSI thresholds (if RSI oscillates within a defined band)
// - Identifies the range's highs/lows (with configurable future extensions)
// Two types of zones plotted with 'boxes':
// 1. **Range close box**: frames the main consolidation zone (candle bodies)
// 2. **Order block box**: tighter zone around the extremes (highs/lows of closes)
// A midline is drawn at the center of the order block (dashed)
// If price breaks the range boundaries, the zone is removed (range ended)
Release Notes
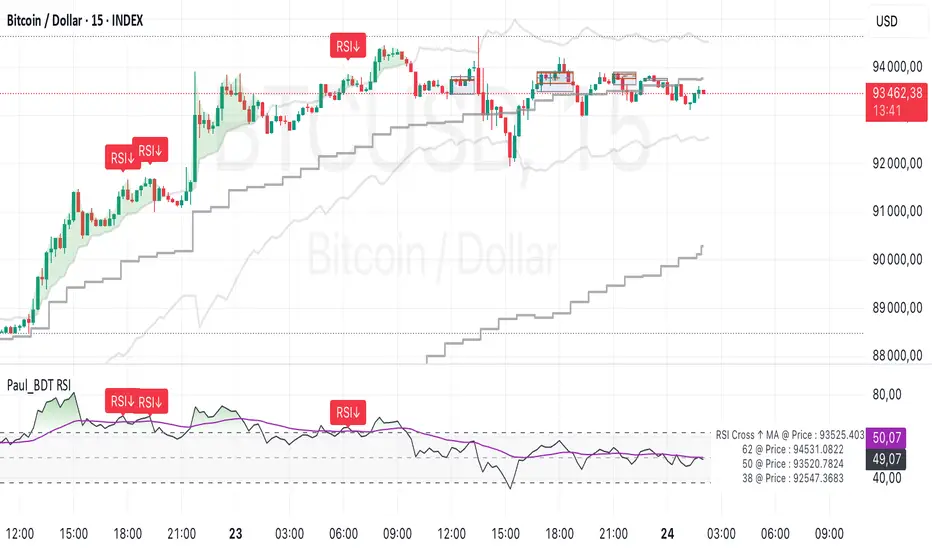
//=====================================================================RSI with Divergence, Order Blocks, Channel & Prediction panel
// Combines:
// 1. Classic RSI with overbought/oversold levels
// 2. Adaptive RSI bands (calculated dynamically with EMA of gains/losses)
// 3. Optional RSI smoothing and Bollinger Bands
// 4. Detection of regular RSI/price divergences (bullish and bearish)
// 5. Range detection (consolidation zones) with Order Blocks and dynamic extensions
// 6. Candle coloring based on dynamic RSI momentum thresholds (breakout/breakdown)
// 7. Reverse RSI price level panel for predictive price zones
//
// Features multi-timeframe adaptive bands display (current and higher timeframe).
//=====================================================================
//=======================//
// 1. INPUTS
//=======================//
// - RSI settings: source, length, overbought/oversold levels, higher timeframe, divergence activation and display, adaptive band display
// - Smoothing settings: moving average type for RSI (SMA, EMA, SMMA, WMA, VWMA, or SMA + Bollinger Bands)
// - Order Blocks settings: toggle range boxes, order block boxes, candle colors, customization of zone colors and extensions
// - Prediction panel: displays key RSI price levels (reverse-engineered from RSI thresholds)
// - Agreement toggle: confirms acceptance before usage
//=======================//
// 2. CALCULATIONS
//=======================//
// - Base RSI calculated from the chosen source
// - Optional smoothing applied to RSI with selected MA type (and Bollinger Bands if enabled)
// - Adaptive RSI bands calculated with EMA of gains/losses (close to Wilder's RSI method), dynamically adjusting overbought/oversold levels
// - Multi-timeframe support: fetches adaptive bands from a higher timeframe (e.g., daily) and displays them alongside current timeframe bands
// - Dynamic breakout thresholds based on the price position relative to the 200-period SMA:
// - Bullish center (55) if price > SMA200
// - Bearish center (45) if price <= SMA200
// - Spread of ±2 for breakout/breakdown zones
//=======================//
// 3. PLOTS
//=======================//
// - Classic RSI with overbought/oversold lines and background gradient fill
// - RSI smoothing (MA line) and optional Bollinger Bands
// - Adaptive RSI bands (current and higher timeframe)
// - Candle coloring (barcolor):
// - Green: breakout above upper momentum threshold
// - Red: breakdown below lower momentum threshold
// - Custom color within the neutral momentum zone
//=======================//
// 4. DIVERGENCES
//=======================//
// - Detects regular bullish and bearish RSI/price divergences:
// - Bullish: price forms lower lows, RSI forms higher lows
// - Bearish: price forms higher highs, RSI forms lower highs
// - Displays divergence labels on both the RSI panel and the chart
//=======================//
// 5. RANGE DETECTION & ORDER BLOCKS
//=======================//
// - Automatically detects consolidation ranges based on RSI momentum thresholds
// - Two box types drawn:
// 1. **Range close box**: frames the primary consolidation zone (candle bodies)
// 2. **Order block box**: tighter zone around extreme closes (highs/lows)
// - Midline plotted at the center of the order block box (dashed line)
// - Range zones are dynamically extended into the future and removed if the price breaks out of range
//=======================//
// 6. REVERSE RSI PRICE PANEL
//=======================//
// - Reverse RSI calculations to project RSI threshold levels back to price values:
// - Displays projected prices for RSI 50 crossing, overbought/oversold levels, and user-defined RSI value
// - Price prediction panel shows these levels with custom offsets and decimal precision
Protected script
This script is published as closed-source. However, you can use it freely and without any limitations – learn more here.
Disclaimer
The information and publications are not meant to be, and do not constitute, financial, investment, trading, or other types of advice or recommendations supplied or endorsed by TradingView. Read more in the Terms of Use.