OPEN-SOURCE SCRIPT
Cumulative Delta Volume MTF
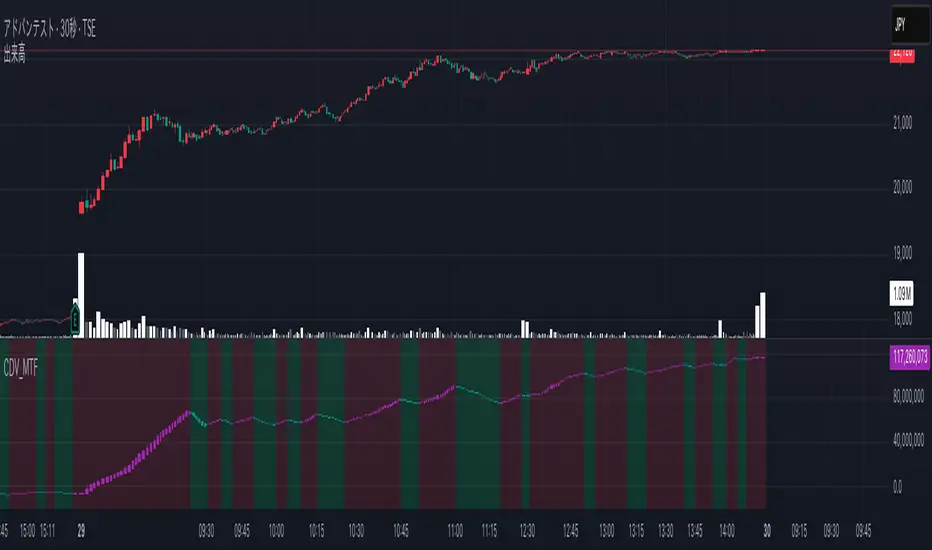
Cumulative Delta Volume MTF (CDV_MTF)
Within volume analytics, “delta (buy − sell)” often acts as a leading indicator for price.
This indicator is a cumulative delta tailored for day trading.
It differs from conventional cumulative delta in two key ways:
Daily Reset
If heavy buying hits into the prior day’s close, a standard cumulative delta “carries” that momentum into the next day’s open. You can then misread direction—selling may actually be dominant, but yesterday’s residue still pushes the delta positive. With Daily Reset, accumulation uses only the current day’s delta, giving you a more reliable, open-to-close read for intraday decision-making.
Timeframe Selection (MTF)
You might chart 30s/15s candles to capture micro structure, while wanting the cumulative delta on 5-minute to judge the broader flow. With Timeframe (MTF), you can view a lower-timeframe chart and a higher-timeframe delta in one pane.
Overview
MTF aggregation: choose the delta’s computation timeframe via Timeframe (empty = chart) (empty = chart timeframe).
Daily Reset: toggle on/off to accumulate strictly within the current session/day.
Display: Candle or Line (Candle supports Heikin Ashi), with Bull/Bear background shading.
Overlays: up to two SMA and two EMA lines.
Panel: plotted in a sub-window (overlay=false).
Example Use Cases
At the open: turn Daily Reset = ON to see the pure, same-day buy/sell build-up.
Entry on lower TF, bias from higher TF: chart at 30s, set Timeframe = 5 to reduce noise and false signals.
Quick read of momentum: Candle + HA + background shading for intuitive direction; confirm with SMA/EMA slope or crosses.
Key Parameters
Timeframe (empty = chart): timeframe used to compute cumulative delta.
Enable Daily Reset: resets accumulation when the trading day changes.
Style: Candle / Line; Heikin Ashi toggle for Candle mode.
SMA/EMA 1 & 2: individual length and color settings.
Background: customize Bull and Bear background colors.
How to Read
Distance from zero: positive build = buy-side dominance; negative = sell-side dominance.
Slope × MAs: use CDV slope and MA direction/crossovers for momentum and potential turns.
Reset vs. non-reset:
ON → isolates intraday net flow.
OFF → tracks multi-day accumulation/dispersion.
Notes & Caveats
The delta here is a heuristic derived from candle body/wick proportions—it is not true bid/ask tape.
MTF updates are based on the selected timeframe’s bar closes; values can fluctuate intrabar.
Date logic follows the symbol’s exchange timezone.
Renders in a separate pane.
Suggested Defaults
Timeframe = 5 (or 15) / Daily Reset = ON
Style = Candle + Heikin Ashi = ON
EMA(50/200) to frame trend context
For the first decisions after the open—and for scalps/day trades throughout the session—MTF × Daily Reset helps you lock onto the flow that actually matters, right now.
==========================
Cumulative Delta Volume MTF(CDV_MTF)
出来高の中でも“デルタ(買い−売り)”は株価の先行指標になりやすい。
本インジケーターはデイトレードに特化した累積デルタです。
通常の累積デルタと異なるポイントは2つ。
デイリーリセット機能
前日の大引けで大きな買いが入ると、通常の累積デルタはその勢いを翌日の寄りにも“持ち越し”ます。実際は売り圧が強いのに、前日の残渣に引っ張られて方向を誤ることがある。デイリーリセットを使えば当日分だけで累積するため、寄り直後からの判断基準として信頼度が上がります。
タイムフレーム指定(MTF)機能
たとえばチャートは30秒足/15秒足で細部の動きを追い、累積デルタは5分足で“大きな流れ”を確認したい──そんなニーズに対応。**一画面で“下位足の値動き × 上位足のフロー”**を同時に把握できます。
概要
MTF対応:Timeframe で集計足を指定(空欄=チャート足)
デイリーリセット:当日分のみで累積(オン/オフ切替)
表示:Candle/Line(CandleはHA切替可)、背景をBull/Bearで自動塗り分け
補助線:SMA/EMA(各2本)を重ね描き
表示先:サブウィンドウ(overlay=false)
使い方の例
寄りのフロー判定:デイリーリセット=オンで、寄り直後の純粋な買い/売りの積み上がりを確認
下位足のエントリー × 上位足のバイアス:チャート=30秒、Timeframe=5分で騙しを減らす
勢いの視認:Candle+HA+背景色で直感的に上げ下げを把握、SMA/EMAの傾きで補強
主なパラメータ
Timeframe (empty = chart):累積に使う時間足
デイリーリセットを有効にする:日付切替で累積をリセット
Style:Candle / Line、Heikin Ashi切替
SMA/EMA 1・2:期間・色を個別設定
背景色:Bull背景 / Bear背景 を任意のトーンに
読み取りのコツ
ゼロからの乖離:+側へ積み上がるほど買い優位、−側は売り優位
傾き×MA:CDVの傾きと移動平均の方向/クロスで転換やモメンタムを推測
日内/日跨ぎの切替:デイリーリセット=オンで日内の純流入出、オフで期間全体の偏り
仕様・注意
本デルタはローソクのボディ/ヒゲ比率から近似したヒューリスティックで、実際のBid/Ask集計とは異なります。
MTFは指定足の確定ベースで更新されます。
日付判定はシンボルの取引所タイムゾーン準拠。
推奨初期セット
Timeframe=5(または15)/デイリーリセット=有効
Style=Candle+HA=有効
EMA(50/200)で流れの比較
寄りの一手、そしてスキャル/デイの判断材料に。MTF×デイリーリセットで、“効いているフロー”を最短距離で捉えます。
Open-source script
In true TradingView spirit, the creator of this script has made it open-source, so that traders can review and verify its functionality. Kudos to the author! While you can use it for free, remember that republishing the code is subject to our House Rules.
Disclaimer
The information and publications are not meant to be, and do not constitute, financial, investment, trading, or other types of advice or recommendations supplied or endorsed by TradingView. Read more in the Terms of Use.