OPEN-SOURCE SCRIPT
K線虛擬幣
// This source code is subject to the terms of the Mozilla Public License 2.0 at mozilla.org/MPL/2.0/
// © dear.simpson
//version=5
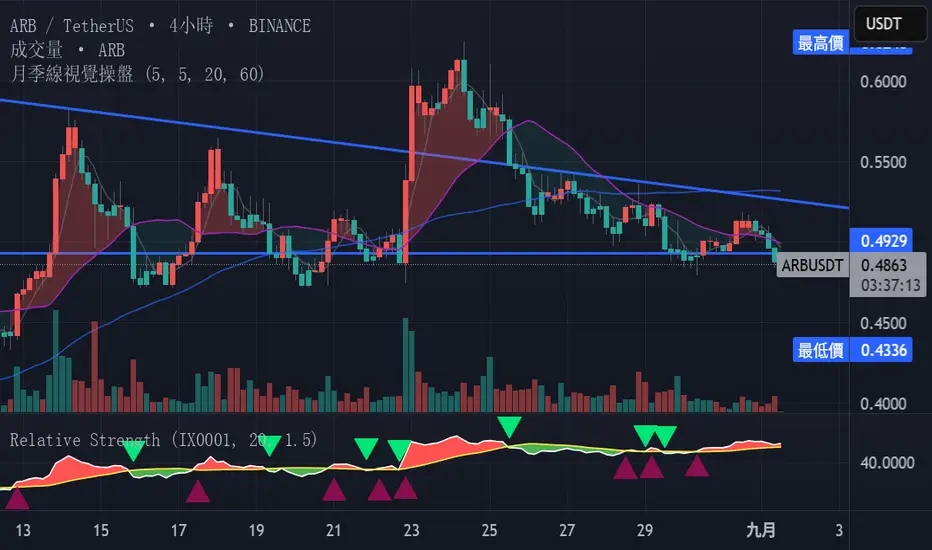
indicator("月季線視覺操盤", "", true)
// Getting inputs
length = input(5, "操盤線週期")
// Calculating
ma = ta.sma(close, length)
spread = close-ma
// Plotcandle
plotcandle(open, high, low, close, title='操盤K線', editable = false , display =display.pane+display.price_scale , color = (spread>=0 ? #ef5350 : #26a69a) , bordercolor= (spread>=0 ? #ef5350 : #26a69a) , wickcolor = #5d606b)
// Getting inputs
maPeriods1 = input( 5 , "MA 1" , group="移動平均線")
maPeriods2 = input(20 , "MA 2" , group="移動平均線")
maPeriods3 = input(60 , "MA 3" , group="移動平均線")
line0 = ta.sma(close, 2)
line1 = ta.sma(close, maPeriods1)
line2 = ta.sma(close, maPeriods2)
line3 = ta.sma(close, maPeriods3)
// Plot Moving Average Line
p0PlotID = plot(line0 ,"MA 0" , color.new(color.black ,100), display = display.none , editable = false)
p1PlotID = plot(line1 ,"MA 1" , color.new(#787b86, 50), display = display.pane+display.price_scale )
p2PlotID = plot(line2 ,"MA 2" , color.new(#787b86, 0), display = display.pane+display.price_scale )
p3PlotID = plot(line3 ,"MA 3" , color.new(color.blue , 30), display = display.pane+display.price_scale )
// Plot Zone Color
fill(p0PlotID, p2PlotID, close > line2 ? color.new(#ef5350, 70) : color.new(#26a69a, 90), '高/低於月線區域顏色')
fill(p0PlotID, p3PlotID, close > line3 ? color.new(#ef5350, 70) : color.new(#26a69a, 90), '高/低於季線區域顏色' , display = display.none )
// © dear.simpson
//version=5
indicator("月季線視覺操盤", "", true)
// Getting inputs
length = input(5, "操盤線週期")
// Calculating
ma = ta.sma(close, length)
spread = close-ma
// Plotcandle
plotcandle(open, high, low, close, title='操盤K線', editable = false , display =display.pane+display.price_scale , color = (spread>=0 ? #ef5350 : #26a69a) , bordercolor= (spread>=0 ? #ef5350 : #26a69a) , wickcolor = #5d606b)
// Getting inputs
maPeriods1 = input( 5 , "MA 1" , group="移動平均線")
maPeriods2 = input(20 , "MA 2" , group="移動平均線")
maPeriods3 = input(60 , "MA 3" , group="移動平均線")
line0 = ta.sma(close, 2)
line1 = ta.sma(close, maPeriods1)
line2 = ta.sma(close, maPeriods2)
line3 = ta.sma(close, maPeriods3)
// Plot Moving Average Line
p0PlotID = plot(line0 ,"MA 0" , color.new(color.black ,100), display = display.none , editable = false)
p1PlotID = plot(line1 ,"MA 1" , color.new(#787b86, 50), display = display.pane+display.price_scale )
p2PlotID = plot(line2 ,"MA 2" , color.new(#787b86, 0), display = display.pane+display.price_scale )
p3PlotID = plot(line3 ,"MA 3" , color.new(color.blue , 30), display = display.pane+display.price_scale )
// Plot Zone Color
fill(p0PlotID, p2PlotID, close > line2 ? color.new(#ef5350, 70) : color.new(#26a69a, 90), '高/低於月線區域顏色')
fill(p0PlotID, p3PlotID, close > line3 ? color.new(#ef5350, 70) : color.new(#26a69a, 90), '高/低於季線區域顏色' , display = display.none )
Open-source script
In true TradingView spirit, the creator of this script has made it open-source, so that traders can review and verify its functionality. Kudos to the author! While you can use it for free, remember that republishing the code is subject to our House Rules.
Disclaimer
The information and publications are not meant to be, and do not constitute, financial, investment, trading, or other types of advice or recommendations supplied or endorsed by TradingView. Read more in the Terms of Use.