OPEN-SOURCE SCRIPT
ETH: Supply in Profit Market Bands
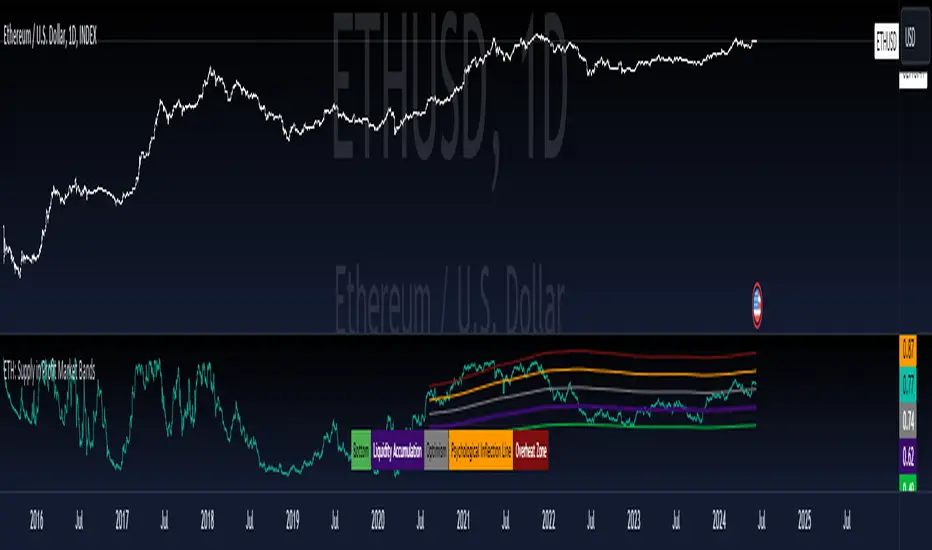
The "ETH: Supply in Profit Market Bands," provides insights into various market bands related to ETH's supply in profit. It visualizes key levels such as liquidity accumulation, bottom, optimism, psychological inflection line, and overheat zone, derived from the historical data of Bitcoin's profit addresses percentage.
The main components of the indicator include:
Supply in Profit: Represents the historical data of Ethereums's supply in profit, plotted as a line graph in the chart.
Additionally, the indicator includes a table that summarizes the legend for each plotted level, providing a clear reference for interpreting the chart. The table displays the legend with corresponding colors for easy identification.
The main components of the indicator include:
Supply in Profit: Represents the historical data of Ethereums's supply in profit, plotted as a line graph in the chart.
- Liquidity Accumulation: Indicates a level derived from a moving average of the profit addresses percentage, highlighting potential areas of liquidity accumulation.
- Bottom: Represents a level indicating the lower boundary or potential support zone in the market.
- Optimism: Reflects a level suggesting optimistic sentiments or potential resistance in the market.
- Psychological Inflection Line: Marks a level that could signal psychological shifts or significant market sentiment changes.
- Overheat Zone: Identifies a level indicating extreme market conditions or potential overbought scenarios.
Additionally, the indicator includes a table that summarizes the legend for each plotted level, providing a clear reference for interpreting the chart. The table displays the legend with corresponding colors for easy identification.
Open-source script
In true TradingView spirit, the creator of this script has made it open-source, so that traders can review and verify its functionality. Kudos to the author! While you can use it for free, remember that republishing the code is subject to our House Rules.
🔍 Access Investing Strategies & Indicators
📊 whop.com/marktquant
🌐 marktquant.com
Nothing shared on this page constitutes financial advice. All information, tools, and analyses are provided solely for informational and educational purposes.
📊 whop.com/marktquant
🌐 marktquant.com
Nothing shared on this page constitutes financial advice. All information, tools, and analyses are provided solely for informational and educational purposes.
Disclaimer
The information and publications are not meant to be, and do not constitute, financial, investment, trading, or other types of advice or recommendations supplied or endorsed by TradingView. Read more in the Terms of Use.