OPEN-SOURCE SCRIPT
Multi TimeFrame Volume
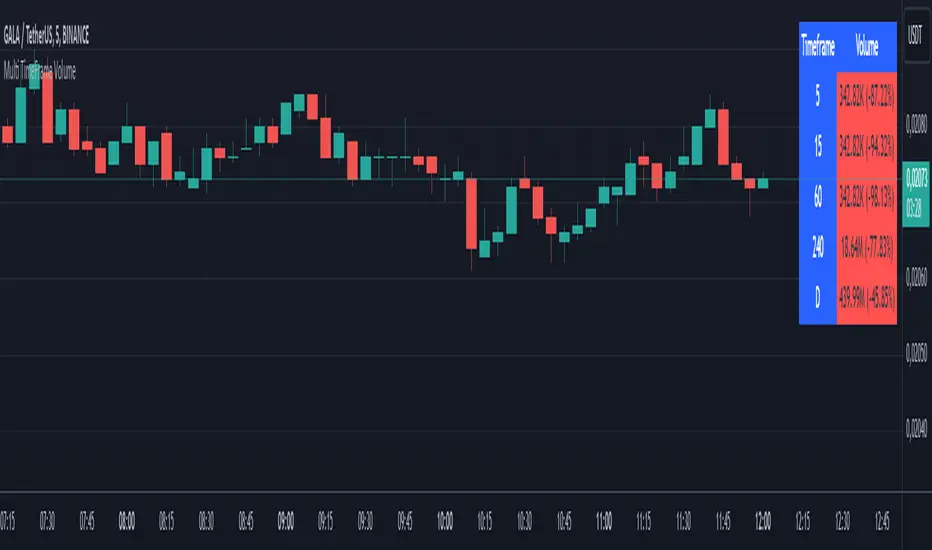
This script, "Multi TimeFrame Volume," is a TradingView Pine Script indicator that displays volume data across five user-selected timeframes in a table. Each volume is formatted in thousands (K) or millions (M) and color-coded based on the percentage change from the previous value (green for increase, red for decrease, gray if unchanged). The table's position and header colors can be customized. This helps traders quickly see volume trends at different intervals on a single chart
Open-source script
In true TradingView spirit, the creator of this script has made it open-source, so that traders can review and verify its functionality. Kudos to the author! While you can use it for free, remember that republishing the code is subject to our House Rules.
Disclaimer
The information and publications are not meant to be, and do not constitute, financial, investment, trading, or other types of advice or recommendations supplied or endorsed by TradingView. Read more in the Terms of Use.