PROTECTED SOURCE SCRIPT
Updated Global Liquidity Index CBC
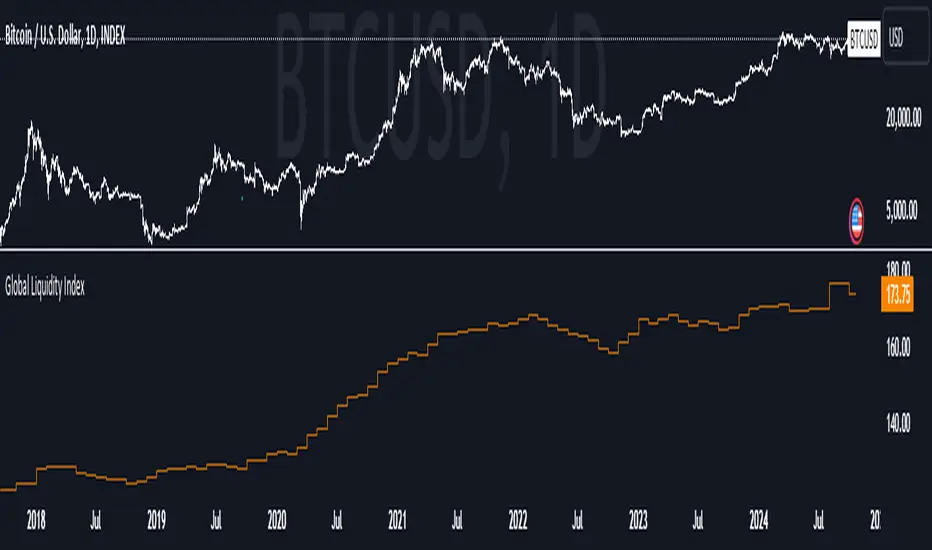
This indicator visualizes global liquidity data. Each bar represents the liquidity level for a given month and year. The y-axis unit is T$.
Release Notes
This indicator visualizes global liquidity data. Each bar represents the liquidity level for a given month and year. The y-axis unit is T$.Release Notes
May updateRelease Notes
new updateRelease Notes
updateRelease Notes
october updateRelease Notes
November Update Protected script
This script is published as closed-source. However, you can use it freely and without any limitations – learn more here.
Disclaimer
The information and publications are not meant to be, and do not constitute, financial, investment, trading, or other types of advice or recommendations supplied or endorsed by TradingView. Read more in the Terms of Use.
Protected script
This script is published as closed-source. However, you can use it freely and without any limitations – learn more here.
Disclaimer
The information and publications are not meant to be, and do not constitute, financial, investment, trading, or other types of advice or recommendations supplied or endorsed by TradingView. Read more in the Terms of Use.