OPEN-SOURCE SCRIPT
Zig Zag Channels [LuxAlgo]
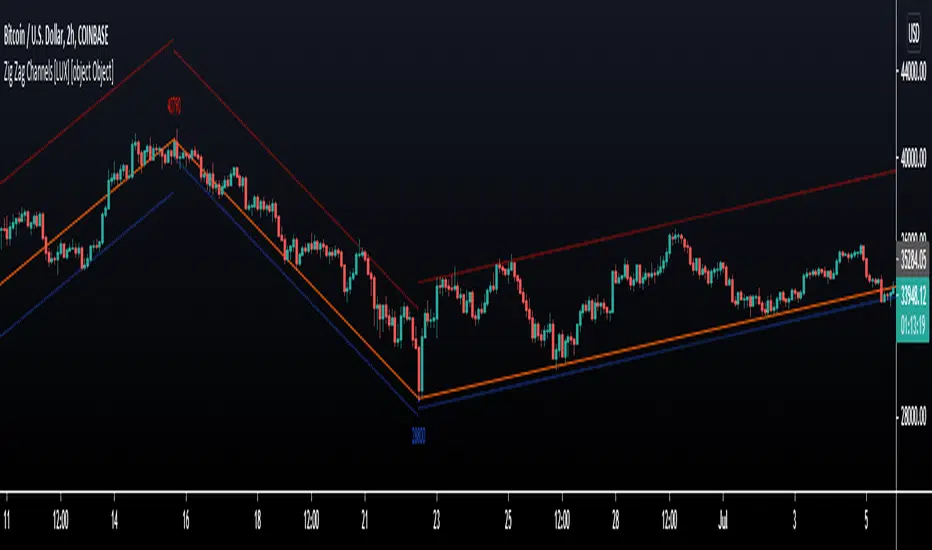
The Zig Zag indicator is a useful indicator when it comes to visualizing past underlying trends in the price and can make the process of using drawing tools easier. The indicator consists of a series of lines connecting points where the price deviates more than a specific percentage from a maximum/minimum point ultimately connecting local peaks and troughs.
This indicator by its very nature backpaints by default, meaning that the displayed components are offset in the past.
🔶 USAGE
The Zig Zag indicator is commonly used to returns points of references for the usage of specific drawing tools, such as Fibonacci retracements, fans, squares...etc.
The proposed indicator estimates peaks and troughs by using rolling maximums/minimums with a window size determining their significance. This window size approach allows us to have an indicator that works with a certain regularity no matter the scale of the price, something the percentage-based approach struggles with. Additionally, one upper and lower extremity are displayed, highlighting the price point that deviates the most from the Zig Zag lines.
A common usage also includes the easy determination of Elliot wave patterns in the price.

The Zig Zag indicator above highlights a downtrending motive wave.
🔹 Extremities
The novel approach taken by this Zig Zag indicator is the addition of two extremities derived from the distance between the price and the Zig Zag line, thus returning channels. It is uncommon seeing extremities in Zig Zag indicators since the line connecting peaks and troughs has rarely any other utility than seeing trend variations with more clarity and is not meant to provide an accurate estimate of underlying local trends in the price.
This channel can be useful to study the potential relationship between underlying trends and the Zig Zag line. A low width between the Zig Zag and the upper extremity indicates price variations mostly located below the Zig Zag while equal width indicates more linear trends.

When the indicator is extended to the last line, the extremities provide potential support and resistances, thus making this indicator able to forecast price variations.
🔶 SETTINGS
🔹 Style
This indicator by its very nature backpaints by default, meaning that the displayed components are offset in the past.
🔶 USAGE
The Zig Zag indicator is commonly used to returns points of references for the usage of specific drawing tools, such as Fibonacci retracements, fans, squares...etc.
The proposed indicator estimates peaks and troughs by using rolling maximums/minimums with a window size determining their significance. This window size approach allows us to have an indicator that works with a certain regularity no matter the scale of the price, something the percentage-based approach struggles with. Additionally, one upper and lower extremity are displayed, highlighting the price point that deviates the most from the Zig Zag lines.
A common usage also includes the easy determination of Elliot wave patterns in the price.
The Zig Zag indicator above highlights a downtrending motive wave.
🔹 Extremities
The novel approach taken by this Zig Zag indicator is the addition of two extremities derived from the distance between the price and the Zig Zag line, thus returning channels. It is uncommon seeing extremities in Zig Zag indicators since the line connecting peaks and troughs has rarely any other utility than seeing trend variations with more clarity and is not meant to provide an accurate estimate of underlying local trends in the price.
This channel can be useful to study the potential relationship between underlying trends and the Zig Zag line. A low width between the Zig Zag and the upper extremity indicates price variations mostly located below the Zig Zag while equal width indicates more linear trends.
When the indicator is extended to the last line, the extremities provide potential support and resistances, thus making this indicator able to forecast price variations.
🔶 SETTINGS
- Length: Determines the significance of the detected peaks and troughs.
- Extend To Last Bar: Extend the most recent line to the most recent closing price value.
- Show Extremities: Displays the extremities.
- Show Labels: Display labels highlighting the high/low prices located at peaks and troughs.
🔹 Style
- Upper Extremity Color: Color of the upper extremity displayed by the indicator.
- Zig Zag Color: Color of the ZigZag lines.
- Lower Extremity Color: Color of the lower extremity displayed by the indicator.
Release Notes
Minor changes.Open-source script
In true TradingView spirit, the creator of this script has made it open-source, so that traders can review and verify its functionality. Kudos to the author! While you can use it for free, remember that republishing the code is subject to our House Rules.
Get exclusive indicators & AI trading strategies: luxalgo.com
Free 150k+ community: discord.gg/lux
All content provided by LuxAlgo is for informational & educational purposes only. Past performance does not guarantee future results.
Free 150k+ community: discord.gg/lux
All content provided by LuxAlgo is for informational & educational purposes only. Past performance does not guarantee future results.
Disclaimer
The information and publications are not meant to be, and do not constitute, financial, investment, trading, or other types of advice or recommendations supplied or endorsed by TradingView. Read more in the Terms of Use.
Open-source script
In true TradingView spirit, the creator of this script has made it open-source, so that traders can review and verify its functionality. Kudos to the author! While you can use it for free, remember that republishing the code is subject to our House Rules.
Get exclusive indicators & AI trading strategies: luxalgo.com
Free 150k+ community: discord.gg/lux
All content provided by LuxAlgo is for informational & educational purposes only. Past performance does not guarantee future results.
Free 150k+ community: discord.gg/lux
All content provided by LuxAlgo is for informational & educational purposes only. Past performance does not guarantee future results.
Disclaimer
The information and publications are not meant to be, and do not constitute, financial, investment, trading, or other types of advice or recommendations supplied or endorsed by TradingView. Read more in the Terms of Use.