OPEN-SOURCE SCRIPT
Ceres Trader Inv DXY % Overlay
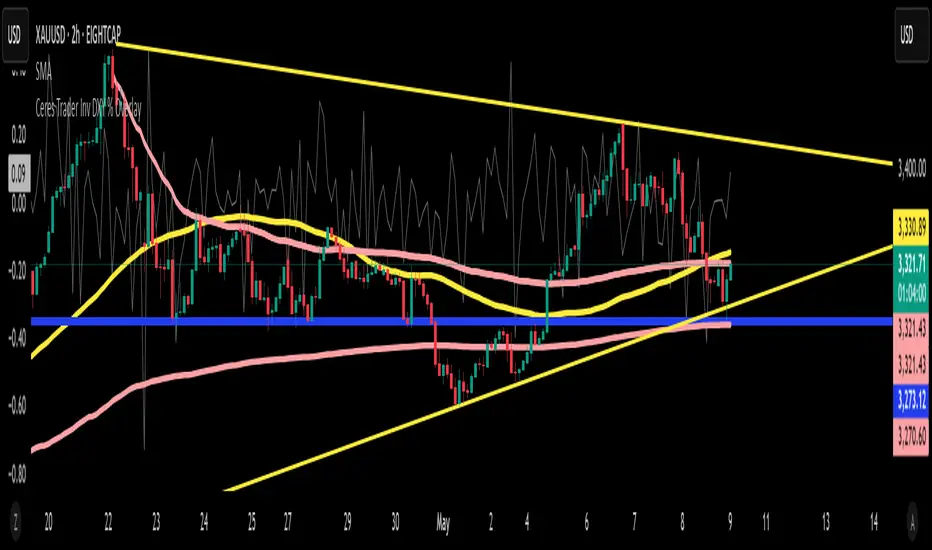
Introducing the “Inverse DXY % Overlay” for TradingView
What it does:
• Plots the U.S. Dollar Index (DXY) as an inverted %-change line directly over your primary chart (e.g. XAUUSD).
• Dollar strength shows as a downward line; dollar weakness shows as an upward line—instantly highlighting negative correlation.
Why it helps:
• Trend confirmation – Ride Gold breakouts only when the dollar is actually weakening.
• Divergence signals – Spot early turn setups when Gold and DXY % don’t move in sync.
• Risk management – Trim or tighten stops when the dollar pivots against your position.
Key features:
Overlay on any symbol (Gold, Silver, Oil, Crypto, equities)
Auto-scaled to left-axis %, so your price chart stays on the right
Lightweight & transparent—1 px grey line, minimal clutter
Now you’ll have a real-time, inverted DXY % line beneath your candles—perfect for gauging USD flow before you pull the trigger on any trade.
Happy trading! 🚀
—Michael (Ceres Trader)
Open-source script
In true TradingView spirit, the creator of this script has made it open-source, so that traders can review and verify its functionality. Kudos to the author! While you can use it for free, remember that republishing the code is subject to our House Rules.
Message Me to Join My Private, Premium Telegram Signals Channel. Also available for private coaching and trading sessions. t.me/CeresTraderSignals
Disclaimer
The information and publications are not meant to be, and do not constitute, financial, investment, trading, or other types of advice or recommendations supplied or endorsed by TradingView. Read more in the Terms of Use.