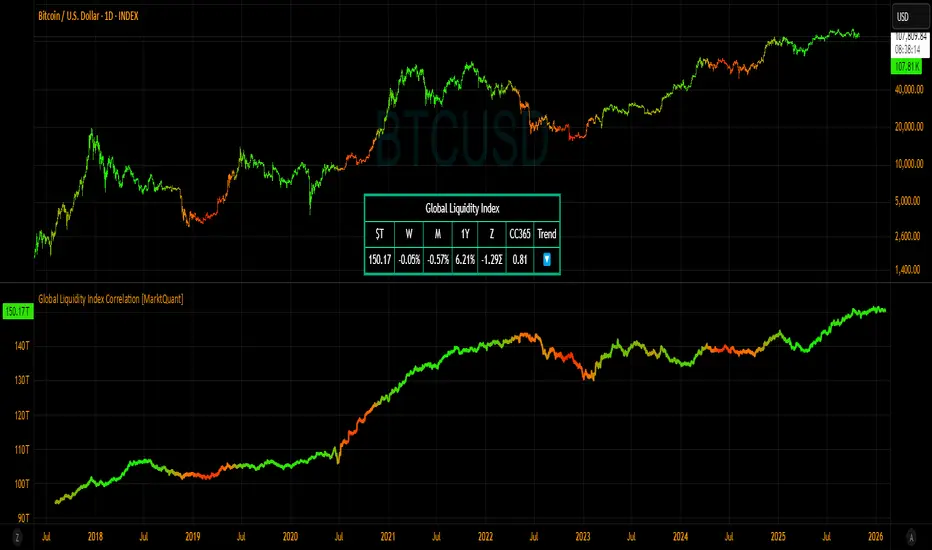
Global Liquidity Index Correlation [MarktQuant]
Core Functionality
It aggregates liquidity data from sources like the U.S. Federal Reserve, ECB, PBC, BOJ, and others, converting everything to USD. Users can view either the total liquidity (GL Index) or its Rate of Change (GLI RoC), with options to smooth the data and adjust time periods for momentum and correlation analysis.
Visual Features
A table at the bottom center summarizes key stats: total liquidity (in trillions), weekly/monthly/yearly RoC, a correlation score with the asset’s price, and a trend arrow. The plotted line uses a color gradient (red to green) to show correlation direction and strength.
Use Case
Ideal for traders looking to connect global liquidity shifts with market movements, it’s flexible for both short- and long-term analysis.
Customization
Adjust smoothing, RoC period, lag for correlation, display mode, and which data sources to include.
This tool offers a clear, customizable way to monitor liquidity’s market influence.
Underlying component returns NaN(Data Error).
I will reupdated it once the data is available.
- Added individual boolean input options to enable or disable each data source within the Global Liquidity Index.
- Introduced a Chinese Proxy Liquidity Index to capture regional liquidity dynamics.
- Added a Net Fed Liquidity Reserve Index for enhanced tracking of U.S. monetary conditions.
Invite-only script
Only users approved by the author can access this script. You'll need to request and get permission to use it. This is typically granted after payment. For more details, follow the author's instructions below or contact MarktQuant directly.
Note that this private, invite-only script has not been reviewed by script moderators, and its compliance with House Rules is undetermined. TradingView does NOT recommend paying for or using a script unless you fully trust its author and understand how it works. You may also find free, open-source alternatives in our community scripts.
Author's instructions
📊 whop.com/marktquant
🌐 marktquant.com
Nothing shared on this page constitutes financial advice. All information, tools, and analyses are provided solely for informational and educational purposes.
Disclaimer
Invite-only script
Only users approved by the author can access this script. You'll need to request and get permission to use it. This is typically granted after payment. For more details, follow the author's instructions below or contact MarktQuant directly.
Note that this private, invite-only script has not been reviewed by script moderators, and its compliance with House Rules is undetermined. TradingView does NOT recommend paying for or using a script unless you fully trust its author and understand how it works. You may also find free, open-source alternatives in our community scripts.
Author's instructions
📊 whop.com/marktquant
🌐 marktquant.com
Nothing shared on this page constitutes financial advice. All information, tools, and analyses are provided solely for informational and educational purposes.