OPEN-SOURCE SCRIPT
Updated TICK Charting & Divergences
Overview
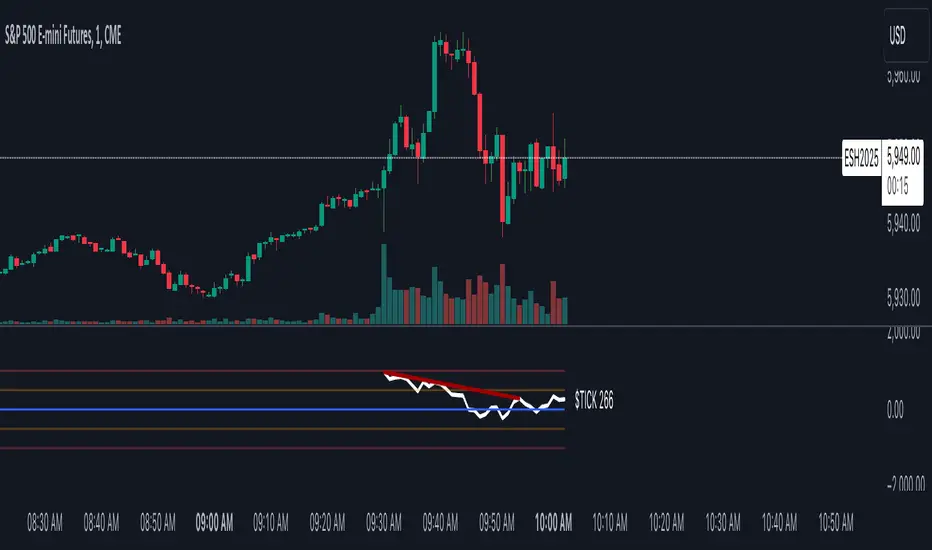
The TICK index measures the number of NYSE stocks making an uptick versus a downtick. This indicator identifies divergences between price action and TICK readings, potentially signaling trend reversals.
Key Features
TICK Internals Interpretation
Best Practices
Settings Optimization
Warning Signs
Remember: TICK divergences are not guaranteed signals. Always use proper risk management and combine with other technical analysis tools.
The TICK index measures the number of NYSE stocks making an uptick versus a downtick. This indicator identifies divergences between price action and TICK readings, potentially signaling trend reversals.
Key Features
- Real-time TICK monitoring during market hours (9:30 AM - 4:00 PM ET)
- Customizable smoothing factor for TICK values
- Regular and hidden divergences detection
- Reference lines at ±500 and ±1000 levels
- Current TICK value display
TICK Internals Interpretation
- Above +1000: Strong buying pressure, potential exhaustion
- Above +500: Moderate buying pressure
- Below -500: Moderate selling pressure
- Below -1000: Strong selling pressure, potential exhaustion
Best Practices
- Use in conjunction with support/resistance levels, market trend direction, and time of day.
- Higher probability setups with multiple timeframe confirmation, divergence at key price levels, and extreme TICK readings (±1000).
Settings Optimization
- Smoothing Factor: 1-3 (lower for faster signals)
- Pivot Lookback: 5-10 bars (adjust based on timeframe)
- Range: 5-60 bars (wider for longer-term signals)
Warning Signs
- Multiple failed divergences
- Choppy price action
- Low volume periods
- Major news events pending
Remember: TICK divergences are not guaranteed signals. Always use proper risk management and combine with other technical analysis tools.
Release Notes
Updated with better chart image.Release Notes
Updated naming in indicator pane.Open-source script
In true TradingView spirit, the creator of this script has made it open-source, so that traders can review and verify its functionality. Kudos to the author! While you can use it for free, remember that republishing the code is subject to our House Rules.
Disclaimer
The information and publications are not meant to be, and do not constitute, financial, investment, trading, or other types of advice or recommendations supplied or endorsed by TradingView. Read more in the Terms of Use.
Open-source script
In true TradingView spirit, the creator of this script has made it open-source, so that traders can review and verify its functionality. Kudos to the author! While you can use it for free, remember that republishing the code is subject to our House Rules.
Disclaimer
The information and publications are not meant to be, and do not constitute, financial, investment, trading, or other types of advice or recommendations supplied or endorsed by TradingView. Read more in the Terms of Use.