XPrecisionSwing (XPS)
Is a visual representation of the Forces of Supply / Demand in the markets in the form of UP and DOWN waves. The Supply / Demand (denoted by a number on top or below the wave line) is computed using the *MBox Precision Supply / Demand* algorithm. These numbers diligently show the forces of Supply and Demand moving price in the markets. The algorithm for computing the numbers on the top and bottom of the wave lines measures the strength of the Supply / Demand. It is this algorithm that makes this indicator unique as it gives an accurate representation of the forces pulling the market up and down. When forces oppose each other, meaning when the direction of price does not agree with the direction of the Supply or Demand it creates a divergence and an opportunity in the markets. These situations are called BUY / SELL Imbalances. Explanation about this below.
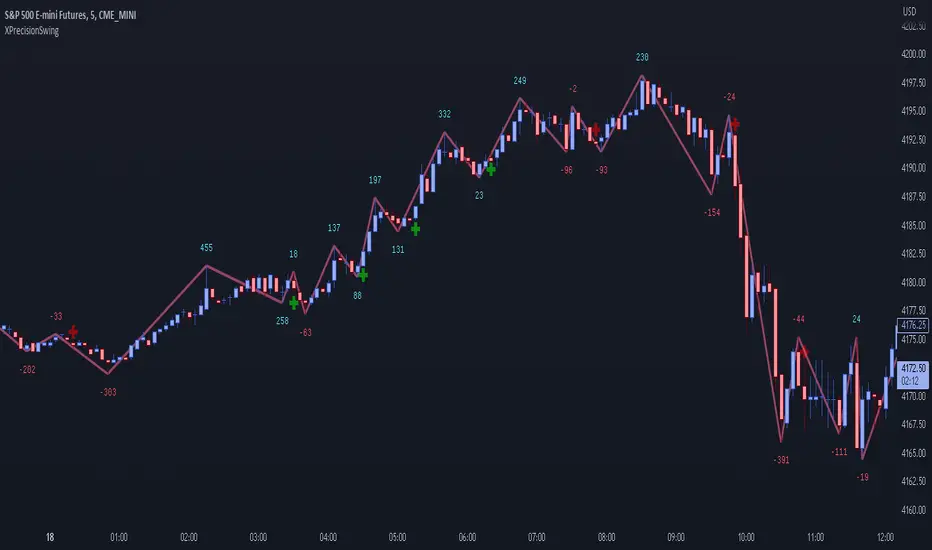
* WHAT THE SCRIPT DOES *
The XPrecisionSwing indicator draws swing waves lines going up and down. These waves lines are representative of Supply and Demand. Waves going up are Demand, while waves going down are Supply. The strength of the Supply / Demand corresponds to the number drawn either on top of the wave line or below it. The numbers drawn on the chart are powered by the *MBox Precision Supply / Demand* algorithm, which are representative of the Forces of Supply / Demand in the markets. This is not just volume added up like in a regular zig zag indicator, since volume alone does not show Supply / Demand, and regular volume will not show BUY / SELL Imbalances as depicted by XPrecisionSwing. Volume summated will not show both positive and negative numbers on the chart. Having Supply / Demand split into both positive and negative numbers allows us to see BUY / SELL Imbalances, which can be a very powerful divergence. Information on how these numbers are computed are in the "HOW IT WORKS" section.
The numbers drawn on the chart can be either negative or positive. Positive relates to Demand, while negative relates to Supply. In this manner the strength of Supply and Demand can be gauged in each wave. If the price goes up but the number is negative (More Supply) it is a divergence and called a SELL Imbalance. This means there was more Supply even though price went up. It is important to pay attention to these scenarios, as often it can be indicative of NO DEMAND. Conversely. if the price goes down but the number is positive (No Demand) it is a divergence and is called a BUY Imbalance. This means there was more Demand even though price went down. This is indicative of NO SUPPLY. As such, it now becomes possible to know when there is a sign of Supply, Demand, No Supply, No Demand, Supply Exhaustion, and Demand exhaustion. Supply occurs when the negative numbers on the charts begin to increase (more negatively). Demand occurs when the positive numbers on the chart begin to increase (more positively). A Supply Exhaustion pattern happens when the price is starting to move down more slowly, while Supply is decreasing, and Demand is increasing. This means that the behavior of the market is changing and also a signal to look to reverse positions. A Demand Exhaustion pattern happens when the price is starting to move up more slowly, while Demand is decreasing, and Supply is increasing. The behavior of the market here is also changing.
* HOW IT WORKS *
- Technical Details for the Numbers on the Swing -
The numbers on the chart represent Supply / Demand. Supply or Demand is determined by analyzing the movement of price and quantity of volume.
When price goes up and is combined with an increase in volume it is Expansion of Demand.
(Positive Numbers get larger)
However if price goes up and is combined with a decrease in volume it is Contraction of Demand.
(Positive Numbers get smaller)
When price goes down and is combined with an increase in volume it is Expansion of Supply.
(Negative Numbers get larger)
However if price goes down and is combined with a decrease in volume it is Contraction of Supply.
(Negative Numbers get smaller)
- Technical Details for the Swing -
The way XPrecisionSwing draws the swings is fractal in nature, which make it very convenient and easier to use over the traditional zig zag indicator. The traditional zig zag indicator uses a tick reversal which needs to be adjusted every time you change time frames. However, with XPrecisionSwing you do not have to change any settings every time you load a different time frame since it will adjust to any time frame you are loading. How the swing is drawn is explained below.
XPrecisionSwing uses 3 bars (by default) to define a swing
This parameter can be adjusted. Can be 1, 2, 4 bars, etc...
Swings are always drawn using High / Low of the bar
- Rules -
To start upswing, bar high needs to be higher than previous 3 candle highs
To start downswing, bar low needs to be lower than previous 3 candle lows
If in upswing, a higher high will continue the upswing
if in downswing, a lower low will continue the downswing
- Exceptions -
If outside bar (both high and low exceeds previous 3 bars) swing will continue in current direction
- Swing Confirmation -
Swing wave line in progress (unconfirmed) is denoted by a brown box around the swing number
Once the brown box disappears, that swing wave and number is confirmed
* HOW TO USE IT *
As the numbers on the down waves increase (negatively), this shows that the bears have taken control of the markets. Conversely, as the numbers on the up waves increase (positively), this shows the bulls have taken control of the markets. Whoever is in control is the direction you generally want to place your trades in. When you see an increase in Supply (numbers on down wave) accompanied with a decrease in Demand (numbers on up wave) this shows a Supply + Demand Exhaustion Pattern. This is stronger than if you only see an increase in Supply without a decrease in Demand.
- The Buy / Sell Imbalances -
If you see a positive blue number on the bottom of a DOWN Wave, this means that there was more buying than selling even though price moved down.
If you see a negative red number on the top of an UP Wave, this means that there was more selling than buying even though price moved up.
Both of these cases signify and imbalance and a divergence.
* EXAMPLE AND USE CASES *
- Sell Imbalance Example -
If you see a large negative number with a lower low on a down wave, and then the next up wave is a lower high also with a negative number it shows that there is only Supply flooding the market and no sign of Demand. This is a very powerful combo.
- Buy Imbalance Example -
If you see a large positive number with a higher high on an up wave, and then the next down wave is a higher low also with a positive number it shows that there is only Demand flooding the market and no sign of Supply. This is a very powerful combo.
- Supply Exhaustion example -
If you see price movement struggling to make newer lows and the Supply numbers on the down waves are decreasing, while the Demand numbers on the up waves are increasing this is indicative of a *Change of Behavior*, and that the market is showing signs of reversal.
- Break out on Demand example -
If you see price has been ranging and now the numbers on the UP waves begin to increase while breaking out of a previous area of resistance, it is a good sign that the movement is backed by the strength coming from the Demand.
* BUY / SELL IMBALANCE ALERTS *
The Green / Red crosses on the chart show exactly where the Buy / Sell Imbalance Alerts trigger.
These will NEVER repaint! The crosses can be hidden in Styles if you wish to.
Alerts can be set very easily with the instructions below.
1. Right Click Chart -> Add Alert...
(Ignore Caution Warning. These alerts will *ONLY* trigger on Confirmed BUY / SELL Imbalances and will NOT repaint)
2. Select Condition to be "XPrecisionSwing"
3. Select "Buy Imbalance" or "Sell Imbalance"
4. Select "Greater Than" with Value = 0
5. Options set "Once Per Bar"
6. Customize Any other Alert Options you want
* WHAT MAKES IT ORIGINAL *
XPrecisionSwing gives an inside look into the markets by showing price movements as a series of waves going up and down with their corresponding Supply / Demand numbers associated with each wave. Reading the numbers shows the strength of Supply / Demand. The bigger the number the stronger the Supply / Demand is. The smaller the number the weaker the Supply / Demand is. It becomes possible to see where Supply / Demand comes in, along with Exhaustion of Supply / Demand to spot opportunities to place trades. The Buy / Sell Imbalances show imbalances where price movement and the direction of the Supply / Demand diverge to create potential opportunities as well.
* AUTHOR *
This script is published by MBoxWave LLC
mboxwave.com/tradingview
Get in contact with me via the contact form
mboxwave.com/contact-form
If bar low is lower than previous swing low, start downswing
If bar high is higher than previous swing high, start upswing
Invite-only script
Only users approved by the author can access this script. You'll need to request and get permission to use it. This is typically granted after payment. For more details, follow the author's instructions below or contact mboxwave directly.
TradingView does NOT recommend paying for or using a script unless you fully trust its author and understand how it works. You may also find free, open-source alternatives in our community scripts.
Author's instructions
mboxwave.com/tradingview
Get in contact with me via the contact form
mboxwave.com/contact-form
Disclaimer
Invite-only script
Only users approved by the author can access this script. You'll need to request and get permission to use it. This is typically granted after payment. For more details, follow the author's instructions below or contact mboxwave directly.
TradingView does NOT recommend paying for or using a script unless you fully trust its author and understand how it works. You may also find free, open-source alternatives in our community scripts.
Author's instructions
mboxwave.com/tradingview
Get in contact with me via the contact form
mboxwave.com/contact-form