OPEN-SOURCE SCRIPT
EquiVolume [LuxAlgo]
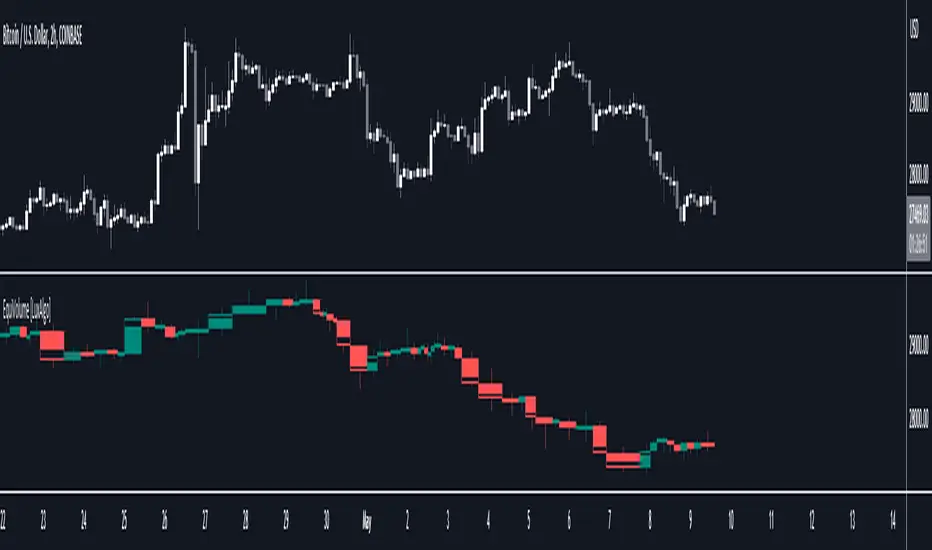
EquiVolume is a charting method that aims to incorporate volume information to a candlestick chart. Volume is highlighted through the candle body width, with wider candles suggesting more significant volume.
Our script shows an EquiVolume chart for the visible chart range. Additionally regular volume can be plotted as a column plot with the column's width controlled by volume.
🔶 SETTINGS
🔹 Options
🔹 Intrabar Analysis
🔹 Width Boxes (bars)
🔶 USAGE
This charting method makes it easier to spot large volume candles, against comparing candles to volume.

Another example:

Additionally, users can make the script perform an intrabar analysis on the chart candles, allowing to highlight bullish/bearish activity within a candle. The script can estimate bullish/bearish trading activity within a candle or simply use intrabar candle signs.
Example
- 15-minute candle is green
- 10 1-minute candles (LTF) IN that 15-minute candle are green -> 10/15 = 66,667%
-> The current 15-minute candle will be 66,667% filled with green color.

Note that the script will draw everything from last visible bar at the right to left, as such you can scroll backwards, and the script will show you the data of the visible chart.

Scrolling back will return the following result:

🔶 REMARKS
When the LTF is too far apart from current timeframe, you should get an error. To prevent this, the LTF will automatically rise, giving no error.

When this happens, the adjusted LTF will be displayed. Do note, due to a maximum available LTF data, sometimes boxes won't always be visible (since there is no LTF data anymore)
To solve this, just elevate your LTF:

When the set LTF is higher than current TF, you would normally get an error as well.
This script will automatically adjust the LTF to current TF, together with a visible warning (no error though).

Due to the inability to draw a line in the space between bars, sometimes a wick won't be placed exactly in the middle.

Our script shows an EquiVolume chart for the visible chart range. Additionally regular volume can be plotted as a column plot with the column's width controlled by volume.
🔶 SETTINGS
🔹 Options
- Chart: Shows candles with volume adjusted width.
- Volume: Shows volume with volume adjusted width.
🔹 Intrabar Analysis
- Enable/disable: When LTF is enabled, the script will calculate the % volume/candles in the same direction than current timeframe.
- You can choose a LTF between 1 and 240 minutes.
- Type %:
- Volume: sum of volume of all LTF candles, which are in the same direction.
- #bars: sum of all LTF candles, which are in the same direction.
🔹 Width Boxes (bars)
- Minimum width: sets the minimum width of a box (candle/volume)
- Maximum width: sets the maximum width of a box (candle/volume)
🔶 USAGE
This charting method makes it easier to spot large volume candles, against comparing candles to volume.
Another example:
Additionally, users can make the script perform an intrabar analysis on the chart candles, allowing to highlight bullish/bearish activity within a candle. The script can estimate bullish/bearish trading activity within a candle or simply use intrabar candle signs.
Example
- 15-minute candle is green
- 10 1-minute candles (LTF) IN that 15-minute candle are green -> 10/15 = 66,667%
-> The current 15-minute candle will be 66,667% filled with green color.
Note that the script will draw everything from last visible bar at the right to left, as such you can scroll backwards, and the script will show you the data of the visible chart.
Scrolling back will return the following result:
🔶 REMARKS
When the LTF is too far apart from current timeframe, you should get an error. To prevent this, the LTF will automatically rise, giving no error.
When this happens, the adjusted LTF will be displayed. Do note, due to a maximum available LTF data, sometimes boxes won't always be visible (since there is no LTF data anymore)
To solve this, just elevate your LTF:
When the set LTF is higher than current TF, you would normally get an error as well.
This script will automatically adjust the LTF to current TF, together with a visible warning (no error though).
Due to the inability to draw a line in the space between bars, sometimes a wick won't be placed exactly in the middle.
Open-source script
In true TradingView spirit, the creator of this script has made it open-source, so that traders can review and verify its functionality. Kudos to the author! While you can use it for free, remember that republishing the code is subject to our House Rules.
Get exclusive indicators & AI trading strategies: luxalgo.com
Free 150k+ community: discord.gg/lux
All content provided by LuxAlgo is for informational & educational purposes only. Past performance does not guarantee future results.
Free 150k+ community: discord.gg/lux
All content provided by LuxAlgo is for informational & educational purposes only. Past performance does not guarantee future results.
Disclaimer
The information and publications are not meant to be, and do not constitute, financial, investment, trading, or other types of advice or recommendations supplied or endorsed by TradingView. Read more in the Terms of Use.