Kernel Market Dynamics
OVERVIEW
Kernel Market Dynamics Pro (KMD Pro) is a revolutionary market regime detection system that employs Maximum Mean Discrepancy (MMD) - a cutting-edge statistical technique from machine learning - to identify when market behavior diverges from its recent historical distribution patterns. The system transforms complex statistical divergence analysis into actionable trading signals through kernel density estimation, regime classification algorithms, and multi-dimensional visualization frameworks that reveal hidden market transitions before traditional indicators can detect them.
WHAT MAKES IT ORIGINAL
While conventional indicators measure price or momentum divergence, KMD Pro analyzes distribution divergence - detecting when the statistical properties of market returns fundamentally shift from their baseline state. This approach, borrowed from high-frequency trading and quantitative finance, uses kernel methods to map market data into high-dimensional feature spaces where regime changes become mathematically detectable. The system is the first TradingView implementation to combine MMD with real-time regime visualization, making institutional-grade statistical arbitrage techniques accessible to retail traders.
HOW IT WORKS (Technical Methodology)
1. KERNEL DENSITY ESTIMATION ENGINE
Maximum Mean Discrepancy (MMD) Calculation:
The core innovation - measures distance between probability distributions:
• Maps return distributions to Reproducing Kernel Hilbert Space (RKHS)
• Computes empirical mean embeddings for reference and test windows
• Calculates supremum of mean differences across all RKHS functions
• MMD = ||μ_P - μ_Q||_H where H is the RKHS induced by kernel k
Three Kernel Functions Available:
RBF (Radial Basis Function) Kernel:
• k(x,y) = exp(-||x-y||²/2σ²)
• Gaussian kernel with smooth, infinite-dimensional feature mapping
• Bandwidth σ controls sensitivity (0.5-10.0 user configurable)
• Optimal for normally distributed returns
• Default choice providing balanced sensitivity
Laplacian Kernel:
• k(x,y) = exp(-|x-y|/σ)
• Exponential decay with heavier tails than RBF
• More sensitive to outliers and sudden moves
• Ideal for volatile, news-driven markets
• Faster regime shift detection at cost of more false positives
Cauchy Kernel:
• k(x,y) = 1/(1 + ||x-y||²/σ²)
• Heavy-tailed distribution from statistical physics
• Robust to extreme values and fat-tail events
• Best for cryptocurrency and emerging markets
• Most stable signals with fewer whipsaws
Implementation Details:
• Reference window: 30-300 bars of baseline distribution
• Test window: 10-100 bars of recent distribution
• Double-sum kernel matrix computation with O(m*n) complexity
• EMA smoothing (period 3) reduces noise in raw MMD
• Real-time updates every bar with incremental calculation
2. REGIME DETECTION FRAMEWORK
Three-State Regime Classification:
STABLE Regime (MMD < threshold):
• Market follows historical distribution patterns
• Mean-reverting behavior dominates
• Low probability of breakouts
• Reduced position sizing recommended
• Visual: Subtle background coloring
SHIFTING Regime (threshold < MMD < 2×threshold):
• Distribution divergence detected
• Transition period with directional bias emerging
• Optimal entry zone for trend-following
• Increased volatility expected
• Visual: Yellow/orange zone highlighting
EXTREME Regime (MMD > 2×threshold):
• Severe distribution anomaly
• Black swan or structural break potential
• Maximum caution required
• Consider hedging or exit
• Visual: Red/magenta warning zones
Adaptive Threshold System:
• Base threshold: 0.05-1.0 (default 0.15)
• Volatility adjustment: ±30% based on ATR ratio
• Regime persistence: 20-bar minimum for stability
• Cooldown periods prevent signal clustering
3. DIRECTIONAL BIAS DETERMINATION
Multi-Factor Direction Analysis:
Distribution Mean Comparison:
• Recent mean = SMA(normalized_returns, test_window)
• Reference mean = SMA(normalized_returns, reference_window)
• Direction = sign(recent_mean - reference_mean)
Momentum Confluence:
• Price momentum = close - close[test_window]
• Volume momentum = volume/SMA(volume, reference_window)
• Weighted composite direction score
Trend Alignment:
• Fast EMA vs Slow EMA positioning
• Slope analysis of regression line
• Multi-timeframe bias confirmation (optional)
4. SIGNAL GENERATION ARCHITECTURE
Entry Signal Logic:
Stage 1 - Regime Shift Detection:
• MMD crosses above threshold
• Sustained for minimum 2 bars
• No signals within cooldown period
Stage 2 - Direction Confirmation:
• Distribution mean aligns with momentum
• Volume ratio > 1.0 (optional)
• Price above/below VWAP (optional)
Stage 3 - Risk Assessment:
• Calculate ATR-based stop distance
• Verify risk/reward ratio > 1.5
• Check for nearby support/resistance
Stage 4 - Signal Generation:
• Long: Regime shift + bullish direction
• Short: Regime shift + bearish direction
• Extreme: MMD > 2×threshold warning
5. PROBABILITY CLOUD VISUALIZATION
Adaptive Confidence Intervals:
• Standard deviation multiplier = 1 + MMD × 3
• Inner band: ±0.5 ATR × multiplier (68% probability)
• Outer band: ±1.0 ATR × multiplier (95% probability)
• Width expands with divergence magnitude
• Real-time adjustment every bar
Interpretation:
• Narrow cloud: Low uncertainty, stable regime
• Wide cloud: High uncertainty, shifting regime
• Asymmetric cloud: Directional bias present
6. MOMENTUM FLOW VECTORS
Three-Style Momentum Visualization:
Flow Arrows:
• Length proportional to momentum strength
• Width indicates confidence (1-3 pixels)
• Angle shows rate of change
• Frequency: Every 5 bars or on events
Gradient Bars:
• Vertical lines from price
• Height = momentum/ATR ratio
• Opacity based on strength
• Continuous flow indication
Momentum Ribbon:
• Envelope around price action
• Expands in momentum direction
• Color intensity shows strength
7. SIGNAL CONNECTION SYSTEM
Relationship Mapping:
• Links consecutive signals with lines
• Solid lines: Same direction (continuation)
• Dotted lines: Opposite direction (reversal)
• Maximum 10 connections maintained
• Distance limit: 100 bars
Purpose:
• Identifies signal clusters
• Shows trend development
• Reveals regime persistence
• Confirms directional bias
8. REGIME ZONE MAPPING
Unified Zone Visualization:
• Main zones: Full regime periods (entry to exit)
• Emphasis zones: Specific trigger points
• Historical memory: Last 20 regime shifts
• Color gradient based on intensity
• Border style indicates zone type
Zone Analytics:
• Duration tracking
• Maximum excursion
• Retest probability
• Support/resistance conversion
9. DYNAMIC RISK MANAGEMENT
ATR-Based Position Sizing:
• Stop loss: 1.0 × ATR from entry
• Target 1: 2.0 × ATR (2R)
• Target 2: 4.0 × ATR (4R)
• Volatility-adjusted scaling
Visual Target System:
• Entry pointer lines
• Target boxes with prices
• Stop boxes with invalidation
• Real-time P&L tracking
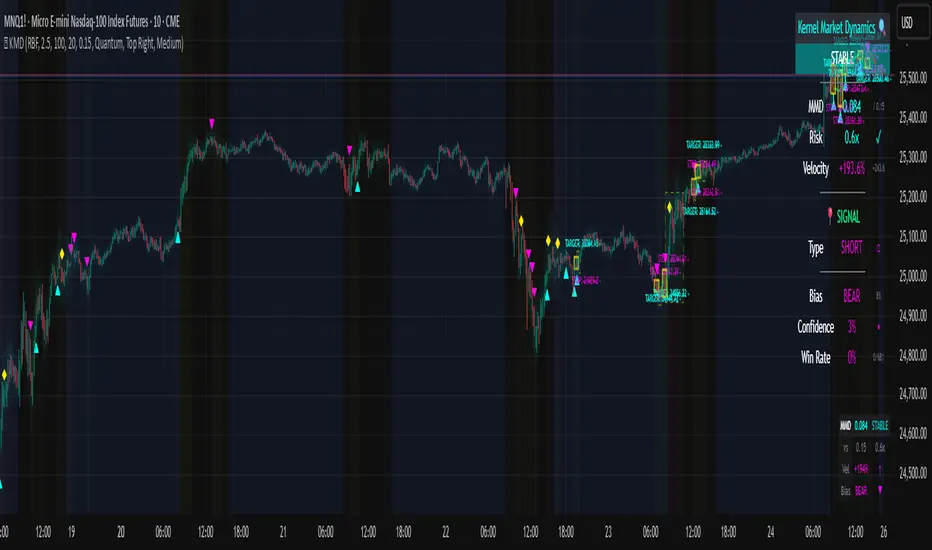
10. PROFESSIONAL DASHBOARD
Real-Time Metrics Display:
Primary Metrics:
• Current MMD value and threshold
• Risk level (MMD/threshold ratio)
• Velocity (rate of change)
• Acceleration (second derivative)
Signal Information:
• Active signal type and entry
• Stop loss and targets
• Current P&L percentage
• Bars since signal
Market Metrics:
• Directional bias (BULL/BEAR)
• Confidence percentage
• Win rate statistics
• Signal count tracking
Visual Design:
• Four position options
• Three size modes
• Five color themes
• Gauge visualizations
• Status banners
11. MMD INFO PANEL
Floating Statistics:
• Compact 3×4 table
• MMD vs threshold comparison
• Velocity with direction arrows
• Current bias indication
• Always-visible reference
FIVE COLOR THEMES
Quantum: Cyan/Magenta/Yellow - Modern, high contrast, optimal visibility
Matrix: Green/Red - Classic terminal aesthetic, traditional
Fire: Orange/Gold/Red - Warm spectrum, energetic feel
Aurora: Northern lights palette - Unique, beautiful gradients
Nebula: Deep space colors - Purple/Blue, futuristic
HOW TO USE
Step 1: Select Your Kernel
• RBF for normal markets (stocks, forex majors)
• Laplacian for volatile markets (small-caps, news-driven)
• Cauchy for fat-tail markets (crypto, emerging markets)
Step 2: Configure Bandwidth
• 0.5-2.0: Scalping (high sensitivity)
• 2.0-5.0: Day trading (balanced)
• 5.0-10.0: Swing trading (smooth signals)
Step 3: Set Analysis Windows
• Reference: 3-5× your holding period
• Test: Reference ÷ 3 approximately
• Adjust based on timeframe
Step 4: Calibrate Threshold
• Start with 0.15 default
• Increase if too many signals
• Decrease for earlier detection
Step 5: Enable Visuals
• Probability Cloud for volatility assessment
• Momentum Flow for direction confirmation
• Regime Zones for historical context
• Signal Connections for trend visualization
Step 6: Monitor Dashboard
• Check MMD vs threshold
• Verify regime state
• Confirm directional bias
• Review confidence metrics
Step 7: Execute Signals
• Wait for triangle markers
• Verify regime shift confirmed
• Check risk/reward setup
• Enter at close or next open
Step 8: Manage Position
• Place stop at calculated level
• Scale out at Target 1 (2R)
• Trail remainder to Target 2 (4R)
• Exit if regime reverses
OPTIMIZATION GUIDE
By Market Type:
Forex Majors:
• Kernel: RBF
• Bandwidth: 2.0-3.0
• Windows: 100/30
• Threshold: 0.15
Stock Indices:
• Kernel: RBF
• Bandwidth: 3.0-4.0
• Windows: 150/50
• Threshold: 0.20
Cryptocurrencies:
• Kernel: Cauchy
• Bandwidth: 2.5-3.5
• Windows: 100/30
• Threshold: 0.10-0.15
Commodities:
• Kernel: Laplacian
• Bandwidth: 2.0-3.0
• Windows: 200/60
• Threshold: 0.15-0.25
By Timeframe:
Scalping (1-5m):
• Test Window: 10-20
• Reference: 50-100
• Bandwidth: 1.0-2.0
• Cooldown: 5-10 bars
Day Trading (15m-1H):
• Test Window: 30-50
• Reference: 100-150
• Bandwidth: 2.0-3.0
• Cooldown: 10-20 bars
Swing Trading (4H-Daily):
• Test Window: 50-100
• Reference: 200-300
• Bandwidth: 3.0-5.0
• Cooldown: 20-50 bars
ADVANCED FEATURES
Multi-Timeframe Capability:
• HTF MMD calculation via security()
• Regime alignment across timeframes
• Fractal analysis support
Statistical Arbitrage Mode:
• Pair trading applications
• Spread divergence detection
• Cointegration breaks
Machine Learning Integration:
• Export signals for ML training
• Regime labels for classification
• Feature extraction support
PERFORMANCE METRICS
Computational Complexity:
• MMD calculation: O(m×n) where m,n are window sizes
• Memory usage: O(m+n) for kernel matrices
• Update frequency: Every bar (real-time)
• Optimization: Incremental updates where possible
Typical Signal Frequency:
• Conservative settings: 2-5 signals/week
• Balanced settings: 5-10 signals/week
• Aggressive settings: 10-20 signals/week
Win Rate Expectations:
• Trend following mode: 40-50% wins, 2:1 reward/risk
• Mean reversion mode: 60-70% wins, 1:1 reward/risk
• Depends heavily on market conditions
IMPORTANT DISCLAIMERS
• This indicator detects statistical divergence, not future price direction
• MMD measures distribution distance, not predictive probability
• Past regime shifts do not guarantee future performance
• Kernel methods are descriptive statistics, not AI predictions
• Requires minimum 100 bars historical data for stability
• Performance varies significantly across market conditions
• Not suitable for illiquid or heavily manipulated markets
• Always use proper risk management and position sizing
• Backtest thoroughly on your specific instruments
• This is an analysis tool, not a complete trading system
THEORETICAL FOUNDATION
The Maximum Mean Discrepancy was introduced by Gretton et al. (2012) as a kernel-based statistical test for comparing distributions. In financial markets, we adapt this technique to detect when return distributions shift, indicating potential regime changes. The mathematical rigor of MMD provides a robust, non-parametric approach to identifying market transitions without assuming specific distribution shapes.
SUPPORT & UPDATES
• Questions or configuration help via TradingView messaging
• Bug reports addressed within 48 hours
• Feature requests considered for monthly updates
• Video tutorials available on request
• Join our community for strategy discussions
FINAL NOTES
KMD Pro represents a paradigm shift in technical analysis - moving from price-based indicators to distribution-based detection. By measuring statistical divergence rather than price divergence, the system identifies regime changes that precede traditional breakouts. This anticipatory capability, combined with comprehensive visualization and risk management, provides traders with an institutional-grade toolkit for navigating modern market dynamics.
Remember: The edge comes not from the indicator alone, but from understanding when market distributions diverge from their normal state and positioning accordingly. Use KMD Pro as part of a complete trading strategy that includes fundamental analysis, risk management, and market context.
Invite-only script
Only users approved by the author can access this script. You'll need to request and get permission to use it. This is typically granted after payment. For more details, follow the author's instructions below or contact DskyzInvestments directly.
TradingView does NOT recommend paying for or using a script unless you fully trust its author and understand how it works. You may also find free, open-source alternatives in our community scripts.
Author's instructions
DAFETradingSystems.com
Disclaimer
Invite-only script
Only users approved by the author can access this script. You'll need to request and get permission to use it. This is typically granted after payment. For more details, follow the author's instructions below or contact DskyzInvestments directly.
TradingView does NOT recommend paying for or using a script unless you fully trust its author and understand how it works. You may also find free, open-source alternatives in our community scripts.
Author's instructions
DAFETradingSystems.com