TREND CIRCLE + DIVERGENCES overlay
Another instrument included is supply and demand (SnD, OrderBlock) to complete the technical to facilitate users in trading activities.
=========================================
This indicator strategy is not suitable for the forex, stock, and crude oil markets. It’s only tested on FCPO and CRYPTO(BTC, ETH, BNB) markets.
In fact, this indicator was built specifically for the Futures Crude Palm Oil ( FCPO ).
And it’s available for ANY TIMEFRAME. The selection of the time frame depends on the strategy. For example, the intraday strategy's appropriate time frame is 3M, 5M, and 15 minutes. For swing/overnight, 15M, 30M, 1H. The best-winning rates = 5M.
===========================================
The TCD INDICATOR ( wave trend ) follows swings in a volatile market which is why this particular indicator is very useful to identify the price at the bottom or the top and also be able to detect trend changes and divergences that occur.
Parameter that’s used
1. Stochastic Relative Strength Index
2. Moving Average ( Super Smooth)
3. Pivot point High-Low
4. Volume Threshold
==============================================
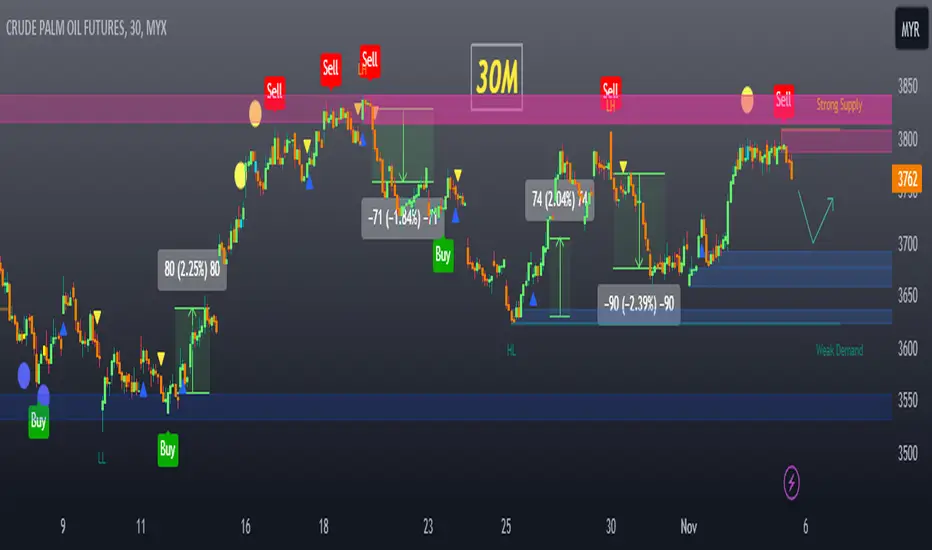
Key of indicator
a) Buy/Sell signals
= Regular divergence allows you to see a trend reversal or continuation. This is the
best signal to make decisions to sell short or buy long.
b) Blue/Yellow circles
= level of oversold/overbought. When it comes out, so trend potentially to reversal/changed.
Here we consider to buy/sell
c) Green/Red triangles
= They happen after oversold/overbought level. Here trend changes from the current trend.
It’s also for buy/sell signals for scalping.
d) Strong signals
= Strong buy/sell signals when both Red/Yellow circles and red Sell/green Buy
signals come out together. There is the best confirmation for the reversal of the
trend. Sometimes triangle signal also occurs. That was a Triple's signal.
e) Supply and Demand zone
= Blue line/background is supply zone and possibility for buy/target(TP) zone.
= Red line/background is demand zone and possibility for sell/target(TP) zone.
===============================================================
Display on the chart
Strong buy/sell
Day trading set-up
Swing set-up
DISCLAIMER:
All technical signals and strategies using this indicator are for educational purposes. Take it at your own risk.
Remove plots that are stacked on the main chart
Invite-only script
Only users approved by the author can access this script. You'll need to request and get permission to use it. This is typically granted after payment. For more details, follow the author's instructions below or contact TraderAsist directly.
Note that this private, invite-only script has not been reviewed by script moderators, and its compliance with House Rules is undetermined. TradingView does NOT recommend paying for or using a script unless you fully trust its author and understand how it works. You may also find free, open-source alternatives in our community scripts.
Author's instructions
Disclaimer
Invite-only script
Only users approved by the author can access this script. You'll need to request and get permission to use it. This is typically granted after payment. For more details, follow the author's instructions below or contact TraderAsist directly.
Note that this private, invite-only script has not been reviewed by script moderators, and its compliance with House Rules is undetermined. TradingView does NOT recommend paying for or using a script unless you fully trust its author and understand how it works. You may also find free, open-source alternatives in our community scripts.