OPEN-SOURCE SCRIPT
Global Money Supply Magic by Near ☄️
Global Money Supply Magic by Near ☄️
Description:
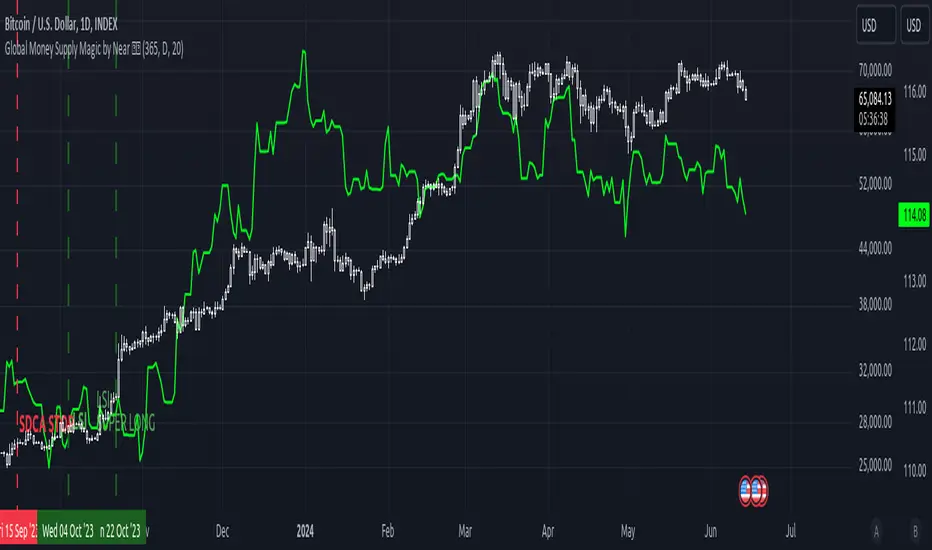
This script, provides a comprehensive visualization of the global money supply across various countries, alongside its rate of change (ROC). It's designed to offer insights into the monetary dynamics that could influence financial markets worldwide.
Key Features:
How to Use:
Adjust the input settings according to your preferences, including visibility toggles, ROC period, resolution, and sensitivity threshold.
Description:
This script, provides a comprehensive visualization of the global money supply across various countries, alongside its rate of change (ROC). It's designed to offer insights into the monetary dynamics that could influence financial markets worldwide.
Key Features:
- Global Money Supply Visualization: The script calculates and displays the global money supply, taking into account the money supply data of major economies such as the United States, China, Japan, the Euro Area, the United Kingdom, and others. This data is normalized to USD for international comparison, providing a unified view of global liquidity.
- Rate of Change (ROC) Analysis: Users have the option to display the ROC of the global money supply, which measures the percentage change in the money supply over a specified period. This feature helps identify periods of rapid expansion or contraction in global liquidity, potentially signaling market shifts.
- Customizable Visibility Toggles: The script includes visibility toggles for both the global money supply and the ROC analysis. This allows users to focus on the aspects they find most relevant to their trading strategy.
- ROC Settings: Traders can adjust the period over which the ROC is calculated, catering to different timeframes such as daily, weekly, or monthly charts. Additionally, a sensitivity threshold is provided to control the aggressiveness of the ROC color shift, enhancing visual clarity.
- Currency Conversion and Data Normalization: The script fetches and converts money supply data from various currencies to USD using current exchange rates. This ensures accurate comparisons across different countries and economic regions.
- Dynamic Color Gradient for ROC: A dynamic color gradient is applied to the ROC line and bar colors, transitioning from green to red based on the ROC value. This visual cue aids in quickly identifying periods of increasing or decreasing global liquidity.
How to Use:
Adjust the input settings according to your preferences, including visibility toggles, ROC period, resolution, and sensitivity threshold.
Open-source script
In true TradingView spirit, the creator of this script has made it open-source, so that traders can review and verify its functionality. Kudos to the author! While you can use it for free, remember that republishing the code is subject to our House Rules.
Disclaimer
The information and publications are not meant to be, and do not constitute, financial, investment, trading, or other types of advice or recommendations supplied or endorsed by TradingView. Read more in the Terms of Use.