PROTECTED SOURCE SCRIPT
Updated Distribution Quarter Indicator
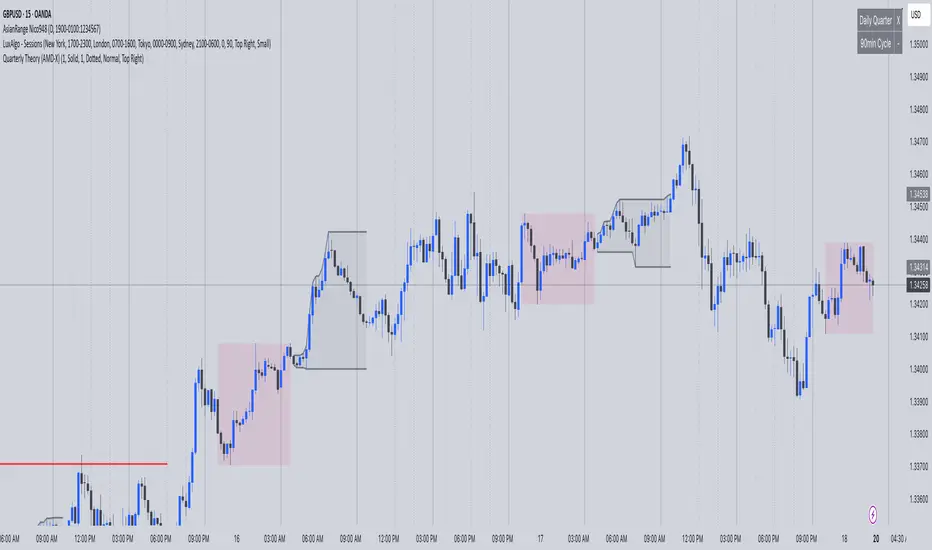
This indicator automatically draws vertical lines at the two most important distribution quarter times in the trading day:
6:00 AM NY time (Market preparation phase)
12:00 PM NY time (Midday distribution period)
Key Features:
✅ 15-minute timeframe only - Designed specifically for intraday distribution analysis
✅ Automatic time detection - Uses NY timezone (UTC-4) for accurate timing
✅ Fully customizable lines - Choose between solid, dotted, or dashed styles
✅ Adjustable line width - Set thickness from 1-5 pixels
✅ Custom colors - Individual color settings for each time marker
✅ Optional labels - Toggle time labels on/off
✅ Historical coverage - Lines appear on all past and future data
Perfect For:
Day traders tracking distribution patterns
Scalpers identifying key time-based levels
Anyone analyzing intraday market structure around quarter periods
How to Use:
Apply to any 15-minute chart
Customize line styles and colors in settings
Lines will automatically appear at the specified NY times
Use as reference points for distribution analysis
Note: Indicator only functions on 15-minute timeframes and includes a helpful reminder if used on other timeframes.
Release Notes
Distribution Quarter IndicatorMark key distribution times with vertical lines at 6:00 AM and 12:00 PM NY time
Features:
Flexible timeframes - Choose 1m, 5m, 15m, 30m, 1H, 4H (15m default)
Future lines - Shows next upcoming quarter times
Customizable - Line style, width, colors, labels
Historical data - Lines on all past candles
Perfect for:
Day traders tracking distribution patterns
Planning entries around key NY session times
Market structure analysis
Setup:
Select timeframes with checkboxes
Customize line appearance in settings
Lines automatically appear at 6:00 AM and 12:00 PM NY time
Simple, clean, and effective for distribution quarter analysis.
Release Notes
V2Protected script
This script is published as closed-source. However, you can use it freely and without any limitations – learn more here.
Disclaimer
The information and publications are not meant to be, and do not constitute, financial, investment, trading, or other types of advice or recommendations supplied or endorsed by TradingView. Read more in the Terms of Use.
Protected script
This script is published as closed-source. However, you can use it freely and without any limitations – learn more here.
Disclaimer
The information and publications are not meant to be, and do not constitute, financial, investment, trading, or other types of advice or recommendations supplied or endorsed by TradingView. Read more in the Terms of Use.