BLITZ PE ANAYLYZER
Following is the method to use the indicator:
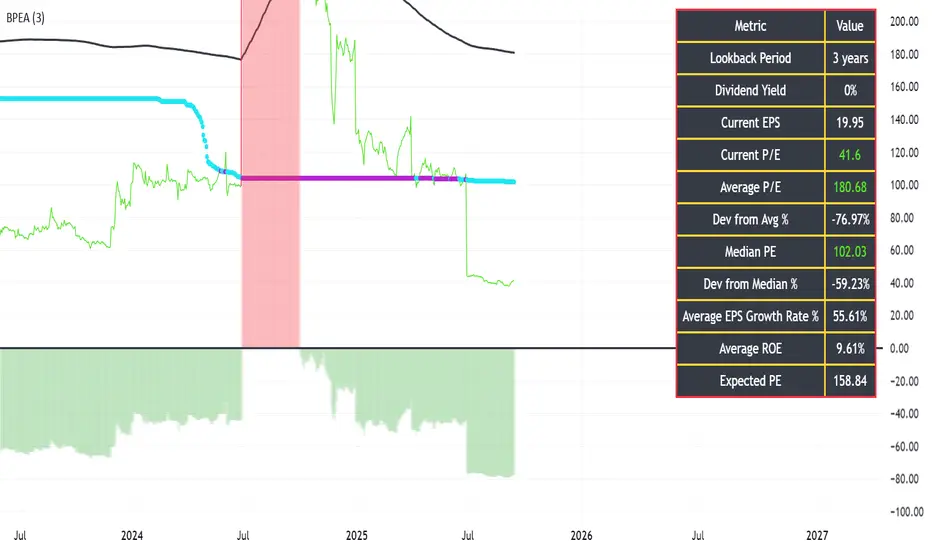
1) User must select the look back years which is by default set to 3 years as per the text book reference from the book "The Intelligent Investor" by Sir Benjamin Graham
2) The red or green histogram represents the deviation of the current PE to the average PE. If the histograms are green in color, it represent buy opportunity because the current PE is lower than that of the average PE values, the % deviation of the current PE from the average value is mentioned in the black color table and a negative value represents under evaluations as compared to the historical PE ratio
3) The black color line is the SMA of the PE ratio.
4) Another plots exists for plotting the current PE which is red or green depending upon its deviation from the average PE values & another plot exists for median PE ratio which is light blue when healthy and purple when not healthy.
5) Using the inflation data and the EPS growth of the company the black table also displays the expected value of the PE ratio for the stock.
Invite-only script
Only users approved by the author can access this script. You'll need to request and get permission to use it. This is typically granted after payment. For more details, follow the author's instructions below or contact Noob1003 directly.
TradingView does NOT recommend paying for or using a script unless you fully trust its author and understand how it works. You may also find free, open-source alternatives in our community scripts.
Author's instructions
Disclaimer
Invite-only script
Only users approved by the author can access this script. You'll need to request and get permission to use it. This is typically granted after payment. For more details, follow the author's instructions below or contact Noob1003 directly.
TradingView does NOT recommend paying for or using a script unless you fully trust its author and understand how it works. You may also find free, open-source alternatives in our community scripts.