Zero-Lag USI Quantum Pulse PRO
IMPORTANT: Before continuing reading this further, it is highly recommended to first read the original USI Quantum Pulse PRO for better understanding. You can do so using the link below (Click on the photo below):

The biggest problem with technical analysis is that the calculations are based on historical data, which causes delayed signals. Line crossovers are late to react, buy signals are delayed to react, and when these signals are shown, the large portion of the profit is lost. This script is unique as it tries to eliminate the lag using predictive future data instead of past data. This way this script is trying to be one step ahead of the data, thus largely removing signal delay.
What are the results of the Zero-Lag USI vs the original USI Quantum Pulse PRO?
In this example, looking at AAPL on a 15 min chart, we can see that Zero-Lag USI crossover signals are quicker than the original USI Quantum Pulse PRO.
In this example of TSLA using a 1 hour chart, Zero-Lag USI gives an entry signals that are 4-5 bars quicker than the original USI.
In this example of USDCAD pair, we can see that the Zero-Lag USI has quicker long signals vs the original USI Quantum Pulse PRO.
Predictive USI Best for Timing of Entry ONLY
This USI was made to be used as a short-term USI in the Dual USI Quantum Pulse PROs system. It can be used for entry signals with any other indicator of your choosing, but should NOT be used as a standalone indicator. You will get many false signals if used as a standalone. This means that in Dual USI System, it should only be used for Timing of the Entries and NOT for Gauging the Overall Direction of the moves. Original USI Quantum Pulse PRO is better when looking to identify the trend direction because it is smoother and thus gives better results.
Dual USI Quantum Pulse PROs System
-In the Dual USI System, we are using the Original USI Quantum Pulse PRO for gauging the overall direction. (Settings: 52, 44, 28, 20, 20, 12)
-In the Dual USI System, we are using the Zero-Lag USI Quantum Pulse PRO for timing of the entries.(Settings: 13, 11, 7, 5, 5, 3)
Steps (In order):
1. We are looking for the dots above the Long-term USI (Original USI). This means that the instrument is in the stage of consolidation. When an instrument is in a consolidation it means that it is gathering strength to go strongly either up or down. How do we know the likely direction? (This leads in step 2)
2. We find out likely direction of the breakout by looking at the way the lines are stacked on the long-term USI
- Red, Orange, Yellow, Blue, Green = Uptrend: We expect the breakout to happen to the
upside. When the lines are positively stacked, only LONG positions should be taken.
- Green, Blue, Yellow, Orange, Red = Downtrend: We expect the breakout to happen to the
downside. When the lines are negatively stacked, only SHORT positions should be taken.
3. When we know that 1:Instrument is in consolidation stage; 2: Likely direction is known with stacked line sequence , we now are ready to look for an entry.
- We use the short-term USI (Zero Lag USI Quantum Pulse PRO) for seeking entries.
- If the lines of long term original USI are stacked ROYBG, we wait for the red line of Zero-
Lag USI Quantum Pulse PRO to cross ABOVE all other lines to go long.
- If the lines of long term original USI are stacked GBYOR, we wait for the red line of
Zero-Lag USI Quantum Pulse PRO to cross BELOW all other lines to go short.
Short Examples:
USD/CAD
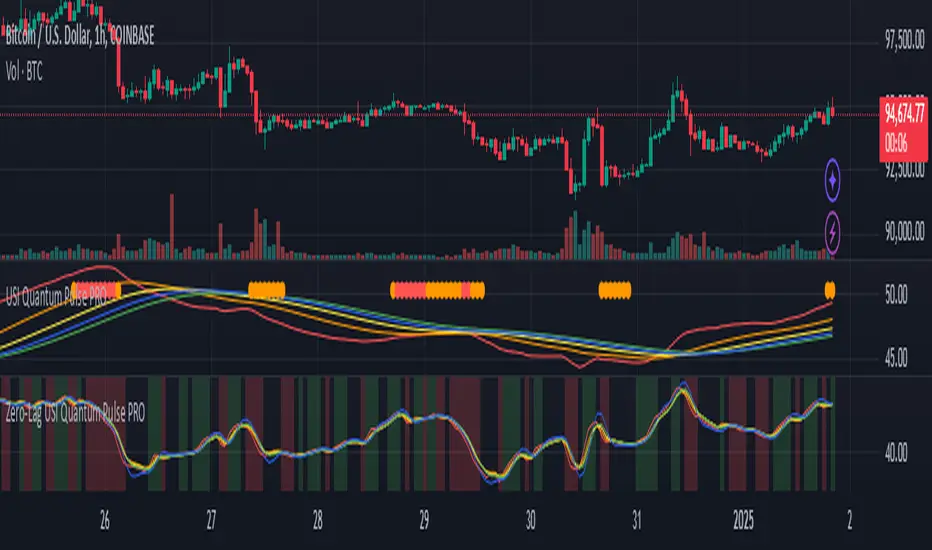
BTC/USD
MSTR (MicroStrategy Incorporated)
GM (General Motors)
Long Example:
AMZN (Amazon)
NQ1! (NASDAQ 100 E-mini Futures)
ETH/USD (Ethereum)
MSFT(Microsoft)
-VERY IMPORTANT
Please remember that no indicator or script can guarantee success, and its effectiveness may change according to market conditions, as past results do not indicate future performance. Always consider your risk tolerance and investment goals before trading. Always back-test your trades to ensure that your trading is profitable before trading live.
Added background to easily see the signal crossovers
-Green Background: The red line (Length 1) crosses above all other lengths showing a timing of the entry to the upside.
-Red Background: The red line (Length 2) crosses below all other lengths, showing a timing of the entry to the downside.
-Added alert conditions to see where the background turns green or red
Invite-only script
Only users approved by the author can access this script. You'll need to request and get permission to use it. This is typically granted after payment. For more details, follow the author's instructions below or contact ADmytrenko2 directly.
Note that this private, invite-only script has not been reviewed by script moderators, and its compliance with House Rules is undetermined. TradingView does NOT recommend paying for or using a script unless you fully trust its author and understand how it works. You may also find free, open-source alternatives in our community scripts.
Author's instructions
Disclaimer
Invite-only script
Only users approved by the author can access this script. You'll need to request and get permission to use it. This is typically granted after payment. For more details, follow the author's instructions below or contact ADmytrenko2 directly.
Note that this private, invite-only script has not been reviewed by script moderators, and its compliance with House Rules is undetermined. TradingView does NOT recommend paying for or using a script unless you fully trust its author and understand how it works. You may also find free, open-source alternatives in our community scripts.