OPEN-SOURCE SCRIPT
Updated Volume Traded in Total Outstanding Shares with basic fundamental
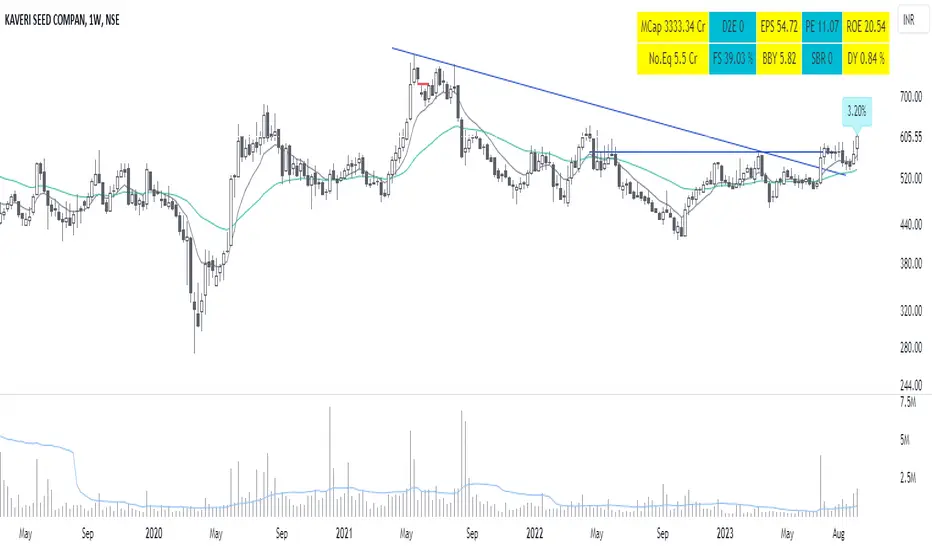
This indicator helps to find Volume Traded in Total Outstanding Shares with basic fundamental parameters like MCAP, EPS, PE, D2E and No. Equity shares.
Release Notes
This indicator helps you to find percentage of stocks traded in a day/week compare to total outstanding shares and few important basic fundamental details of the stock such as, MCap - Market Capitalization
Market capitalization -the total market value of a cryptocurrency circulating supply. A version of Market Capitalization indicator that uses maximum possible supply of the coin, called Fully Diluted Market Capitalization.
EPS - Earning per share
Earnings per Share is the amount of earnings per share of issued, ordinary shares. When companies report financial results, earnings per share is one of the most commonly measured metrics.
PE - Price to Earnings
The Price to earnings ratio measures the market price of a stock relative to its earnings per share. This metric shows how much investors are willing to pay for the profits the company generates.
ROE - Return on Equity
Return on equity is Net income divided by the average of Total shareholders' equity for the last period. Note: if the Total shareholders’ equity is negative, the ratio will be empty or non-existent.
No.Eq - Total common shares outstanding
Total common shares outstanding represents the number of common/ordinary shares issued and actively held by shareholders at the end of the period.
FS - Float shares outstanding
Float shares outstanding represent the number of issued common shares available for open trading on stock exchanges and other financial markets. It excludes closely held or insider shares owned by a company's corporate management and employees, institutional investors who have controlling stakes or seats on the board of directors, or company-owned foundations.
BBY - Buyback yield
Buyback yield is the percentage of the amount spent by a company to repurchase its own shares to its market capitalization. A high Buyback yield may indicate that a stock is undervalued or actively repurchasing its shares.
SBR - Shares buyback ratio
This metric shows the percentage change in Common shares outstanding.
A positive value indicates that the number of shares is declining, while negative values mean that the company is releasing new Common shares. A company can shrink its share base by buying stock back and slowing down the issuance of new shares
DY - Dividend Yield
The dividend yield shows how much a company pays in dividends per year relative to the price of the underlying asset that pays out the dividend. It’s listed as a percentage and is presented as a financial ratio.
Open-source script
In true TradingView spirit, the creator of this script has made it open-source, so that traders can review and verify its functionality. Kudos to the author! While you can use it for free, remember that republishing the code is subject to our House Rules.
Disclaimer
The information and publications are not meant to be, and do not constitute, financial, investment, trading, or other types of advice or recommendations supplied or endorsed by TradingView. Read more in the Terms of Use.