PROTECTED SOURCE SCRIPT
Updated VP buy-sell delta
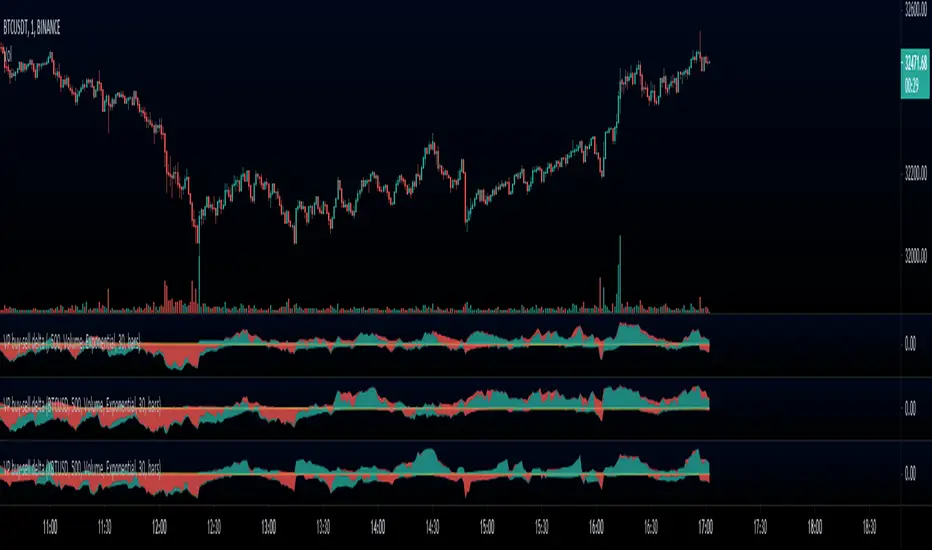
At each bar this indicator computes a customizable volume profile and reports:
- Buy volume in profit: blue above the horizontal
- Buy volume at loss: orange above the horizontal
- Sell volume in profit: orange below the horizontal
- Sell volume at loss: blue below the horizontal
Interpretation is simple: all blue is bullish and all orange is bearish. The oscillator is amenable to traditional oscillator based analyses like divergences and trend line breaks, but also exhibits new phenomena not apparent in traditional volume indicators. For example, a large amount of sell volume at loss - blue below the horizontal - often translates into new buy volume in profit shortly after, appearing as blue above the horizontal. This is a measurement of market participants exiting their positions, a dynamic not visible using traditional volume based tools.
Release Notes
Added trapped buyer/seller mode.Release Notes
Added capacity to select symbol.Release Notes
Added aggregate volume, no need to use the btc version anymore.Release Notes
Backend improvements. Is now much more efficient with volume decay set to "None", can run with VP lengths well above 240 without timing out.Release Notes
Major update to functionality:- Can now display any buyer/seller volume at gain/loss
- Can display buyer - seller deltas
- Can choose to normalize volume (past default behaviour), show raw volume, or show buy/sell volume in ratio mode akin to how TRDR's data is rendered
- Can smooth lines with an EMA (off by default)
Release Notes
Added a zero line.Release Notes
Updated spot aggregate exchanges.Protected script
This script is published as closed-source. However, you can use it freely and without any limitations – learn more here.
Disclaimer
The information and publications are not meant to be, and do not constitute, financial, investment, trading, or other types of advice or recommendations supplied or endorsed by TradingView. Read more in the Terms of Use.
Protected script
This script is published as closed-source. However, you can use it freely and without any limitations – learn more here.
Disclaimer
The information and publications are not meant to be, and do not constitute, financial, investment, trading, or other types of advice or recommendations supplied or endorsed by TradingView. Read more in the Terms of Use.