OPEN-SOURCE SCRIPT
Updated level_stats
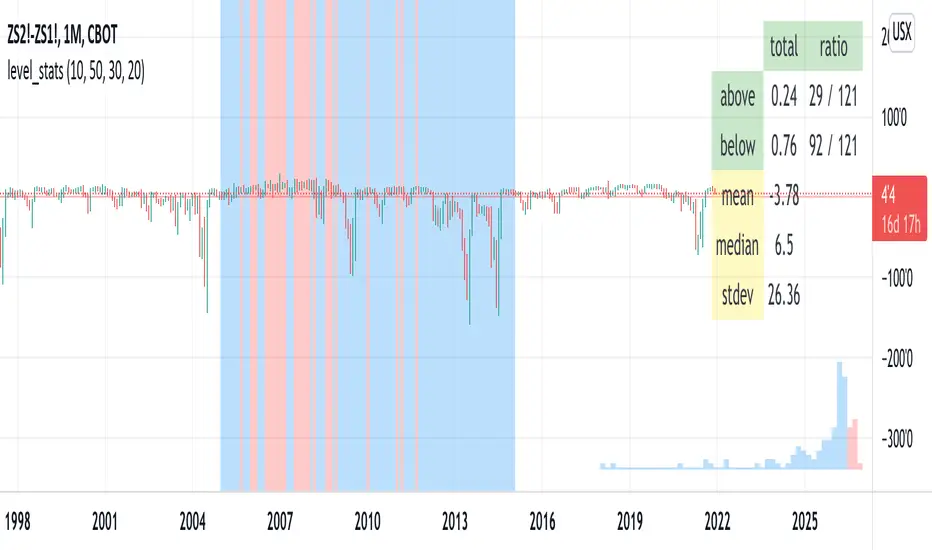
This script tells you the percentage of time an instrument's closing value is above and below a level of your choosing. The background color visually indicates periods where the instrument closed at or above the level (red) and below it (blue). For "stationary-ish" processes, you can get a loose feel for the mean, high, and low values. The historical information conveyed through the background coloring can help you plan derivatives trades. Try with your favorite pairs, commodities, or volatility indices.
Usage: pick a level of interest using the input.
Usage: pick a level of interest using the input.
Release Notes
Added a histogram to depict the distribution of closing prices. Prices less than the "level" input are blue, while those above the level are red. This color scheme is also used to color the chart background.Release Notes
removed some debug codeRelease Notes
added mean, median, and stdevRelease Notes
Added a date selection. The statistics and histogram will reflect only the period [ start, end ).Release Notes
added a horizontal line (light red) to indicate the levelRelease Notes
The histogram's width, height, and number of buckets are now adjustable inputs. More buckets will make the histogram somewhat smoother and more detailed, but at the cost of performance. The maximum number of buckets is probably around 80. The width and height units are "percentage of the screen".I have set the defaults at levels that perform reasonably well.
Open-source script
In true TradingView spirit, the creator of this script has made it open-source, so that traders can review and verify its functionality. Kudos to the author! While you can use it for free, remember that republishing the code is subject to our House Rules.
Disclaimer
The information and publications are not meant to be, and do not constitute, financial, investment, trading, or other types of advice or recommendations supplied or endorsed by TradingView. Read more in the Terms of Use.