PROTECTED SOURCE SCRIPT
r - g Oscillator | Norm + Sigma-Bands
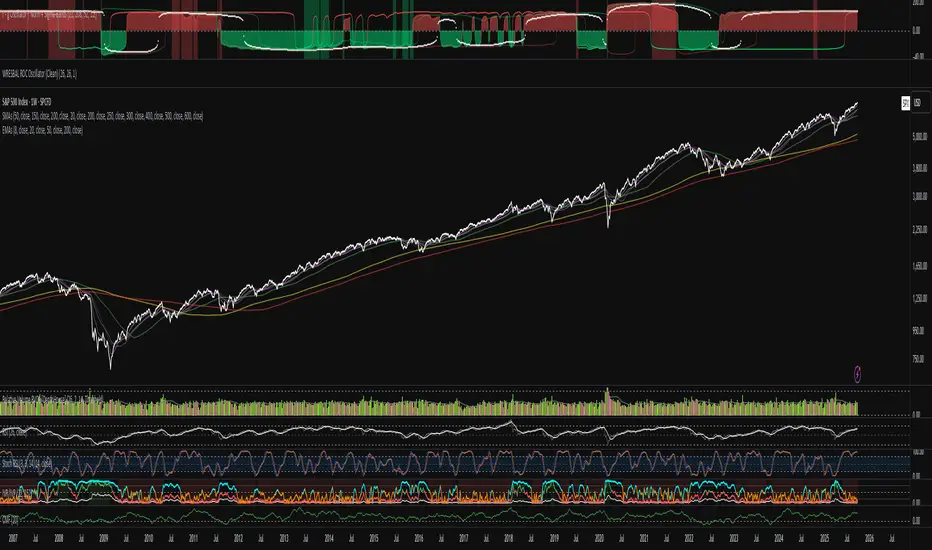
The r–g Oscillator measures the macro-liquidity regime by tracking the gap between real interest rates (r) and nominal GDP growth (g).
It approximates real rate pressure using the 10-Year Treasury yield minus the 5-Year/5-Year forward inflation expectation, and compares that to either Real or Nominal U.S. GDP YoY growth.
Green (g > r): Expansionary backdrop — growth outpaces real yields; liquidity tailwinds.
Red (r > g): Contractionary backdrop — real rates restrictive; liquidity headwinds.
The σ-bands (standard-deviation envelopes) highlight statistically extreme expansions or contractions in the r–g spread.
The “sweet-spot” shading marks moments when r–g breaks strongly above/below zero — early-cycle thrusts or late-cycle stress.
Optional normalization rescales r–g between –1 and +1 to compare across cycles.
Use:
Track shifts in the macro tide rather than short-term waves. Sustained green phases typically align with bull-market environments; red phases often coincide with tightening cycles or recessions. Combine with faster liquidity or breadth measures (e.g., WRESBAL ROC) for tactical confirmation.
Protected script
This script is published as closed-source. However, you can use it freely and without any limitations – learn more here.
Disclaimer
The information and publications are not meant to be, and do not constitute, financial, investment, trading, or other types of advice or recommendations supplied or endorsed by TradingView. Read more in the Terms of Use.