OPEN-SOURCE SCRIPT
Updated Move Magnitude Visualizer (beta)
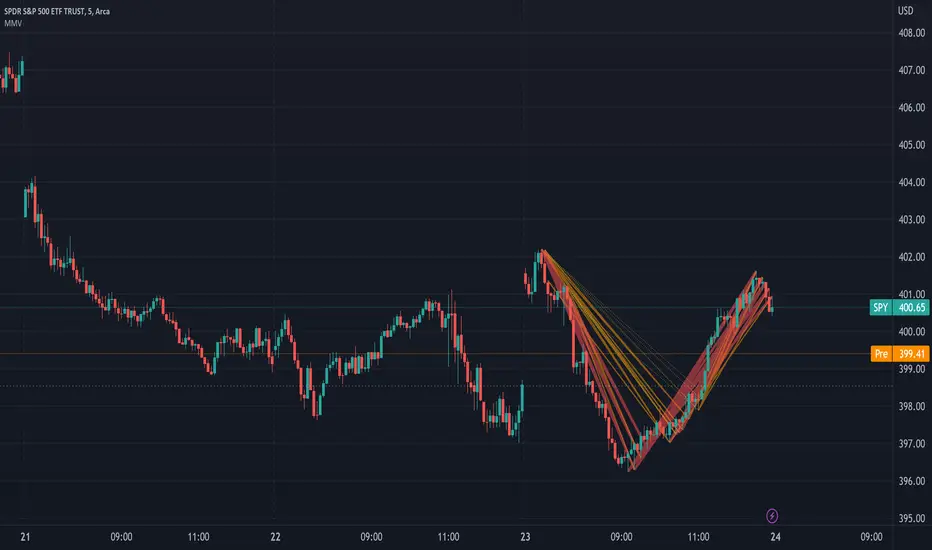
This experimental visualizer measures all price differences across a range of samples to determine what is normal for a measure of time. Based on whether a recent change in price over time has exceeded the norm, a line is drawn to indicate the magnitude/severity of that move. In short, it attempts to visualize when a move is outside the norm and when it may be risky to join that move.
In the end, I've always wanted a tool that gave me a visual warning to when a move is abnormally severe and shouldn't be trusted. RSI and other indicators only work with specific lengths, this attempt to be a deviation detector that isn't bound by length or time-frame.
- A thick red line = greater than 3 standard deviations.
- An orangish/goldish line = greater than 2 standard deviations.
- A thin dotted yellow = greater than 1 standard deviation.
In the end, I've always wanted a tool that gave me a visual warning to when a move is abnormally severe and shouldn't be trusted. RSI and other indicators only work with specific lengths, this attempt to be a deviation detector that isn't bound by length or time-frame.
- This is a work in progress, so feedback is appreciated. I don't have a strong idea yet how to properly visualize this data.
- It is very compute heavy and some users may experience timeouts. I've done everything I can think of to eliminate redundant computer and to optimize for PineScript.
Release Notes
Allow for custom colors.Open-source script
In true TradingView spirit, the creator of this script has made it open-source, so that traders can review and verify its functionality. Kudos to the author! While you can use it for free, remember that republishing the code is subject to our House Rules.
Disclaimer
The information and publications are not meant to be, and do not constitute, financial, investment, trading, or other types of advice or recommendations supplied or endorsed by TradingView. Read more in the Terms of Use.
Open-source script
In true TradingView spirit, the creator of this script has made it open-source, so that traders can review and verify its functionality. Kudos to the author! While you can use it for free, remember that republishing the code is subject to our House Rules.
Disclaimer
The information and publications are not meant to be, and do not constitute, financial, investment, trading, or other types of advice or recommendations supplied or endorsed by TradingView. Read more in the Terms of Use.