OPEN-SOURCE SCRIPT
Correlation Coefficient Table
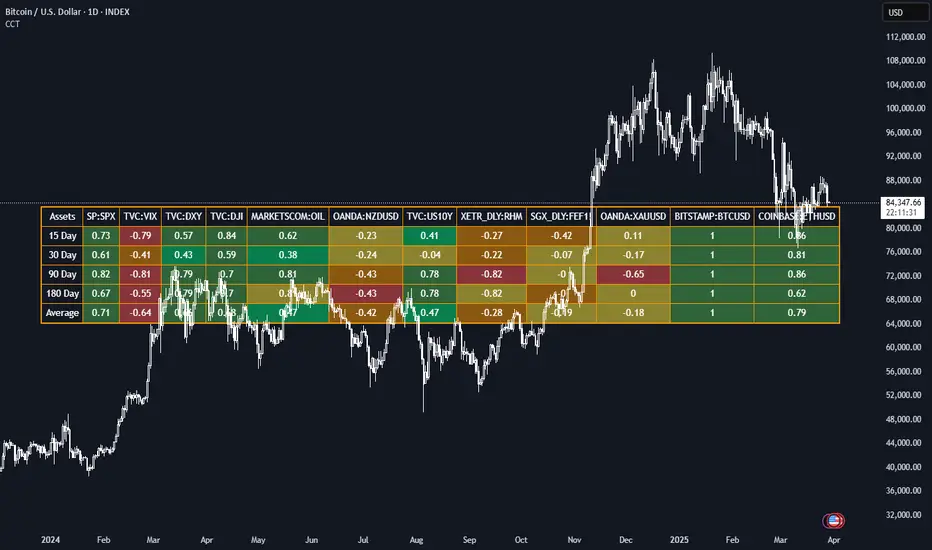
This Pine Script generates a dynamic table for analyzing how multiple assets correlate with a chosen benchmark (e.g., NZ50G). Users can input up to 12 asset symbols, customize the benchmark, and define the beta calculation periods (e.g., 15, 30, 90, 180 days). The script calculates Correlation values for each asset over these periods and computes the average beta for better insights.
The table includes:
Asset symbols: Displayed in the first row.
Correlation values: Calculated for each defined period and displayed in subsequent columns.
Average Correlation: Presented in the final column as an overall measure of correlation strength.
Color coding: Background colors indicate beta magnitude (green for high positive beta, yellow for near-neutral beta, red for negative beta).
Open-source script
In true TradingView spirit, the creator of this script has made it open-source, so that traders can review and verify its functionality. Kudos to the author! While you can use it for free, remember that republishing the code is subject to our House Rules.
Disclaimer
The information and publications are not meant to be, and do not constitute, financial, investment, trading, or other types of advice or recommendations supplied or endorsed by TradingView. Read more in the Terms of Use.